
This competition was incredibly engaging, with active discussions, including those initiated by the hosts. I want to express my gratitude to the organizers for providing such a wonderful opportunity.
\n
My approach is based on an excellent public notebook. I would like to thank the author of that notebook and the many authors of other notebooks that served as its foundation.
\nMy solution is a straightforward extension of the public notebook. The main enhancements are as follows:
\nRegarding the three-dimensional plane fitting, there are several considerations due to the high noise levels in individual frequency signals:
\nThe signals at frequency indices 180 to 186 were particularly puzzling. Despite having significantly larger errors than other frequencies, using these signals to predict all frequencies with Linear Regression led to an impressive RMSE improvement across many frequency bands (with the best CV score reaching 49 ppm). However, this model performed poorly on the test data, failing to deliver any meaningful results.
", "messages": [ { "id": 3033254, "postDate": "2024-11-01T00:31:35.293Z", "content": "This competition was incredibly engaging, with active discussions, including those initiated by the hosts. I want to express my gratitude to the organizers for providing such a wonderful opportunity.
\n
My approach is based on an excellent public notebook. I would like to thank the author of that notebook and the many authors of other notebooks that served as its foundation.
\nMy solution is a straightforward extension of the public notebook. The main enhancements are as follows:
\nRegarding the three-dimensional plane fitting, there are several considerations due to the high noise levels in individual frequency signals:
\nThe signals at frequency indices 180 to 186 were particularly puzzling. Despite having significantly larger errors than other frequencies, using these signals to predict all frequencies with Linear Regression led to an impressive RMSE improvement across many frequency bands (with the best CV score reaching 49 ppm). However, this model performed poorly on the test data, failing to deliver any meaningful results.
", "rawMarkdown": "# 18th Place Solution\n\nThis competition was incredibly engaging, with active discussions, including those initiated by the hosts. I want to express my gratitude to the organizers for providing such a wonderful opportunity.\n\n\n## Solution Summary\n\n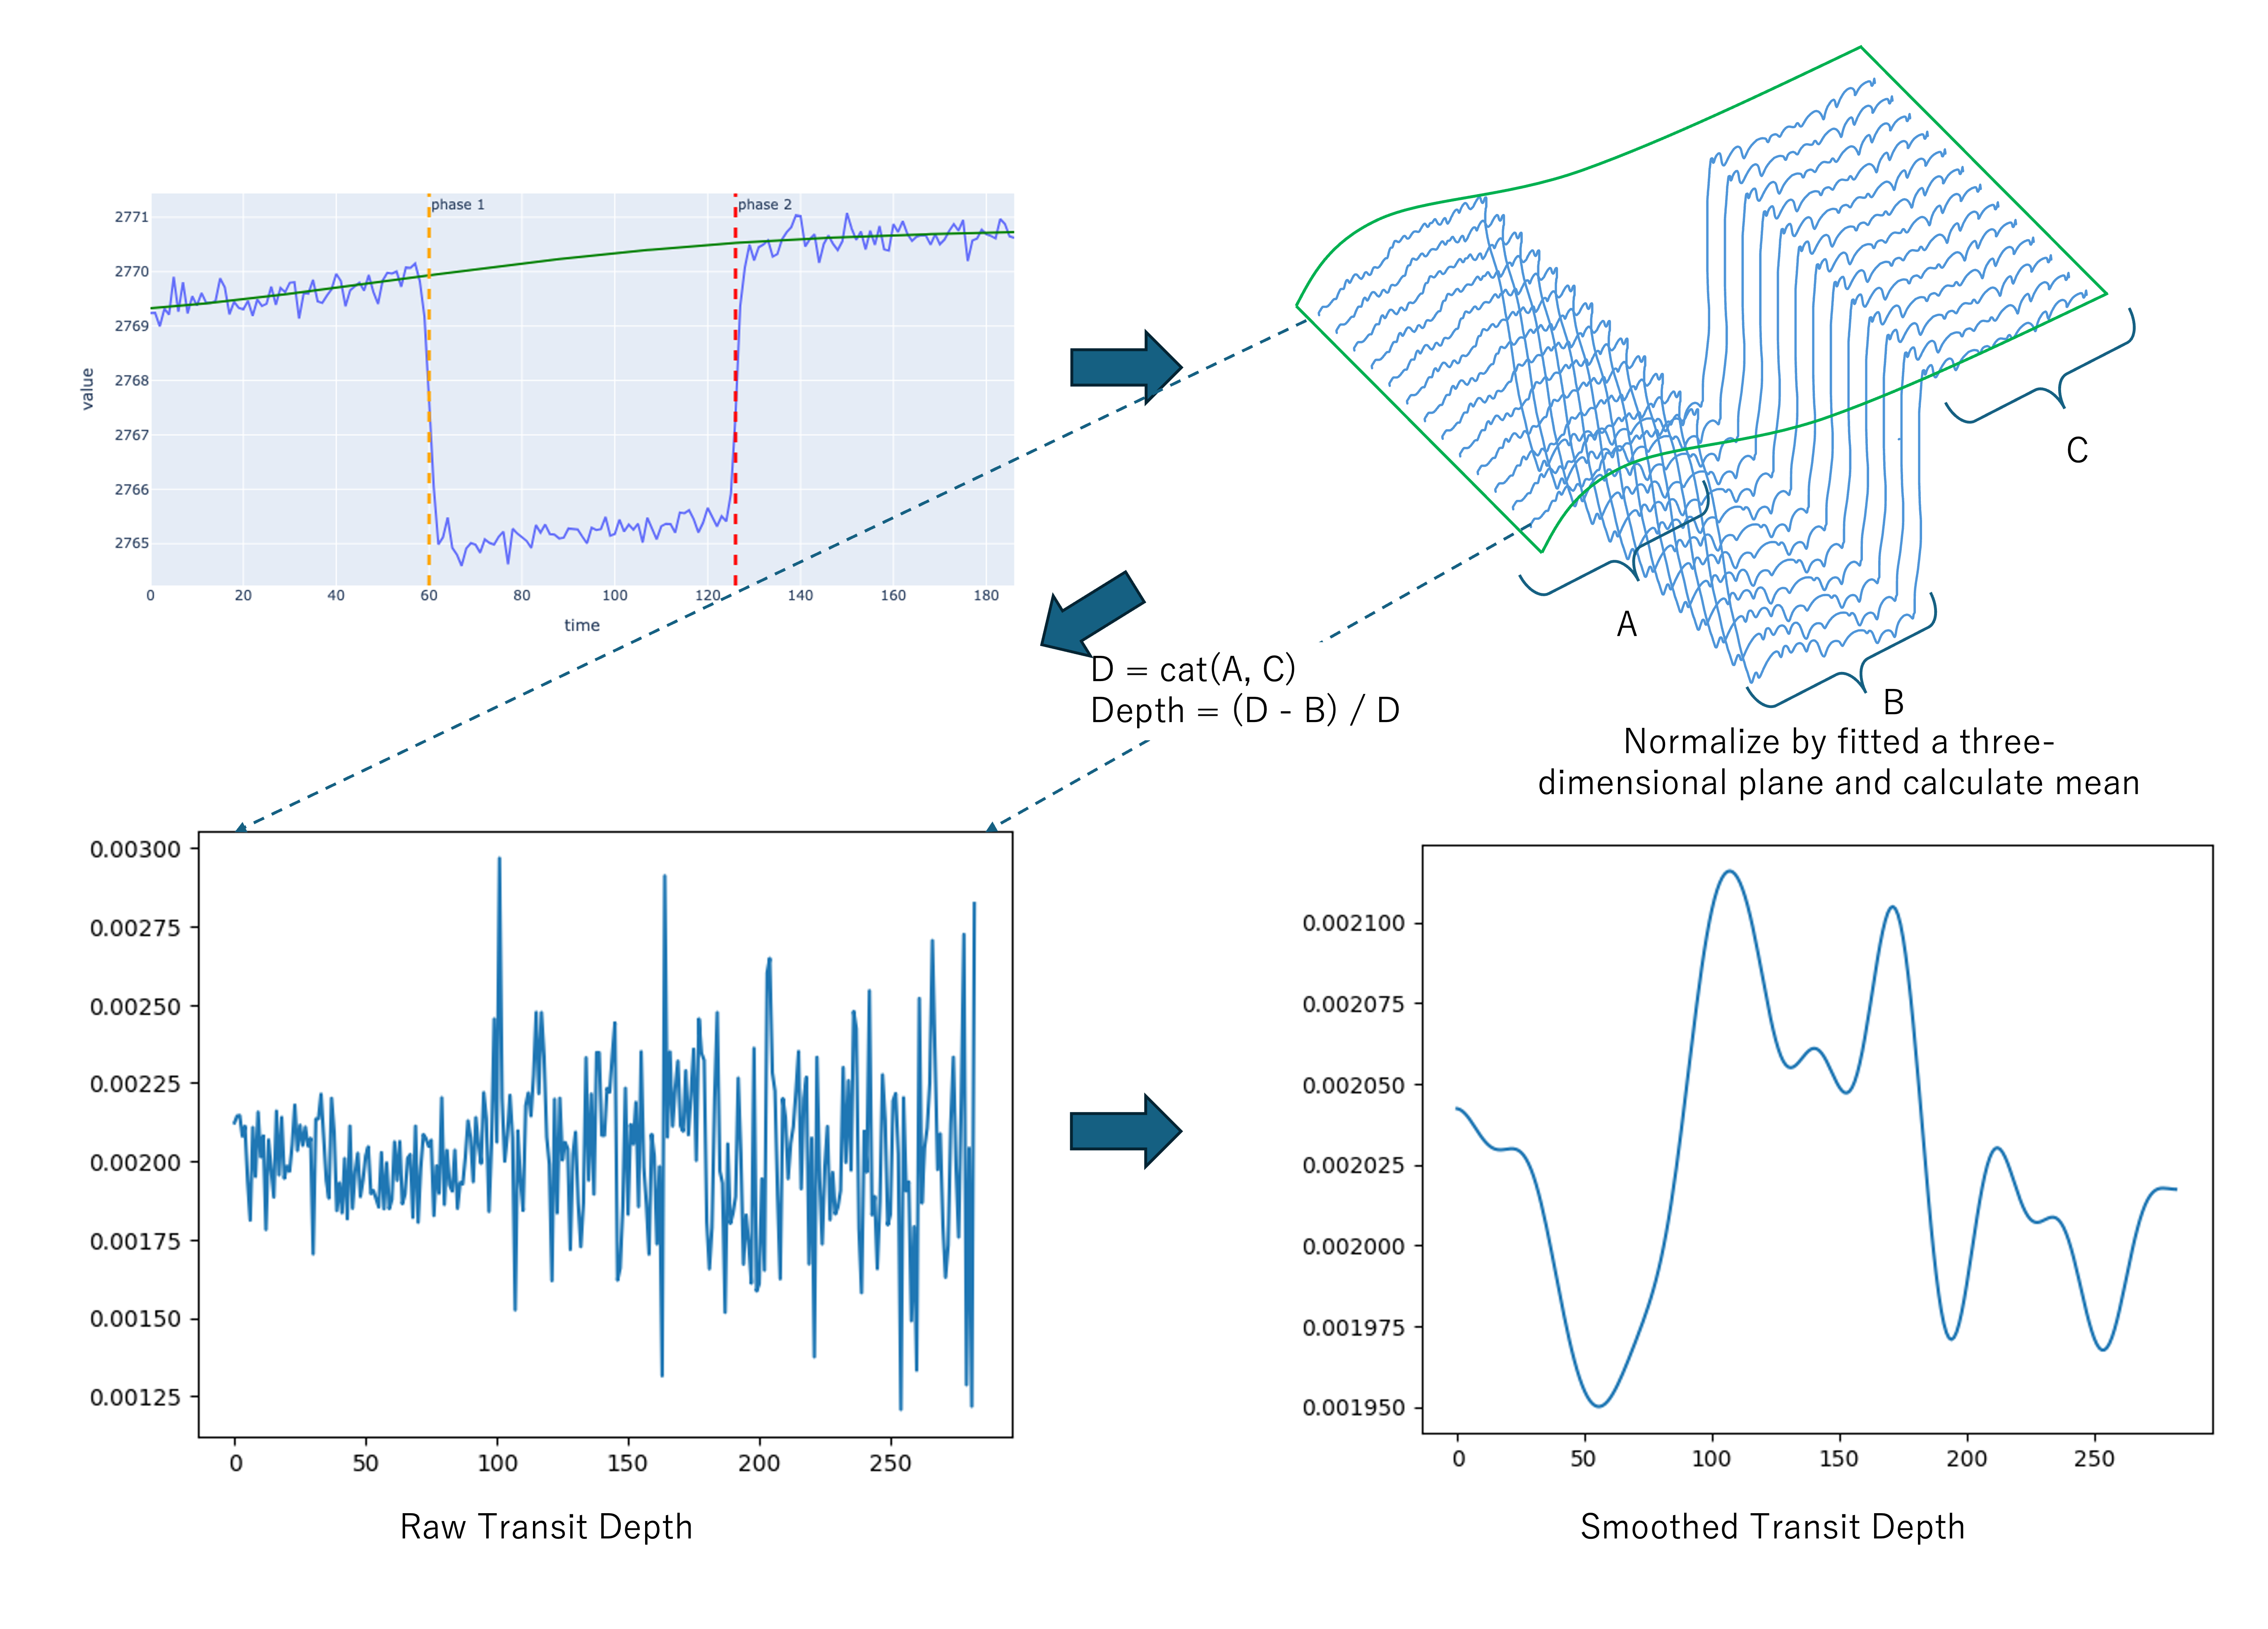\n\nMy approach is based on [an excellent public notebook](https://www.kaggle.com/code/vitalykudelya/neurips-ariel-data-correlation-parallel-scale). I would like to thank the author of that notebook and the many authors of other notebooks that served as its foundation.\n\nMy solution is a straightforward extension of the public notebook. The main enhancements are as follows:\n\n- I modified the polynomial fitting of the flux averated in frequency direction, which was previously done in two dimensions, to fit a three-dimensional plane, including the frequency direction.\n- I adjusted a constant sigma to be estimated individually for each planet.\n\n\nRegarding the three-dimensional plane fitting, there are several considerations due to the high noise levels in individual frequency signals:\n\n- Normalize each frequency individually by its average, as signal intensity varies by frequency.\n- Use the transit phase calculated at the mean frequency directly.\n- Pre-adjust the signals to simulate a depth-free condition using the depth calculated at the mean frequency.\n- Instead of optimizing the depth during three-dimensional plane fitting, normalize flux using the fitted signal and estimate the depth from the ratio of the average flux in transit phase signal to other signals.\n\n## Does Not Work For Me\nThe signals at frequency indices 180 to 186 were particularly puzzling. Despite having significantly larger errors than other frequencies, using these signals to predict all frequencies with Linear Regression led to an impressive RMSE improvement across many frequency bands (with the best CV score reaching 49 ppm). However, this model performed poorly on the test data, failing to deliver any meaningful results.\n", "votes": 22 }, { "id": 3033839, "postDate": "2024-11-01T15:03:36.083Z", "content": "Congratulations!
\nI’m always amazed at your speed of climbing the LB and your wonderful solution!
\nI would like to ask you the details of sigma estimation which is mentioned in the following sentence.
\n\nI adjusted a constant sigma to be estimated individually for each planet.
\n
I’m also curious of your source code, so I’ll appreciate it if you publish the notebook of your solution!
", "rawMarkdown": "Congratulations!\nI’m always amazed at your speed of climbing the LB and your wonderful solution!\nI would like to ask you the details of sigma estimation which is mentioned in the following sentence.\n>I adjusted a constant sigma to be estimated individually for each planet.\n\nI’m also curious of your source code, so I’ll appreciate it if you publish the notebook of your solution!", "votes": 1, "replies": [ { "id": 3034427, "postDate": "2024-11-02T06:07:46.470Z", "content": "Thank you for your interest in my solution.
\nI used scipy.optimize.curve_fit for 3d fitting, and then used the returned statistical information along with the estimated depth’s min, max, std, mean, etc., as inputs to a RandomForestRegressor to estimate the mean value of sigma.
\nSince it was a short-term challenge, the code is quite messy, but I've made the submission notebook public.
https://www.kaggle.com/code/ren4yu/ariel-2024-sub-ensemble
", "rawMarkdown": "Thank you for your interest in my solution.\nI used `scipy.optimize.curve_fit` for 3d fitting, and then used the returned statistical information along with the estimated depth’s min, max, std, mean, etc., as inputs to a RandomForestRegressor to estimate the mean value of sigma.\nSince it was a short-term challenge, the code is quite messy, but I've made the submission notebook public.\n\nhttps://www.kaggle.com/code/ren4yu/ariel-2024-sub-ensemble", "votes": 1, "replies": [ { "id": 3034442, "postDate": "2024-11-02T06:32:54.450Z", "content": "Thank you very much for the reply!
\nI could understand your sigma estimation method well.
\nI’ll read the code for my better understanding.
Hi, may I ask what do you mean by
\n\n", "rawMarkdown": "Hi, may I ask what do you mean by \n>Instead of optimizing the depth during three-dimensional plane fitting, normalize flux using the fitted signal and estimate the depth from the ratio of the average flux in transit phase signal to other signals.", "votes": 1, "replies": [ { "id": 3034437, "postDate": "2024-11-02T06:29:53.967Z", "content": "Instead of optimizing the depth during three-dimensional plane fitting, normalize flux using the fitted signal and estimate the depth from the ratio of the average flux in transit phase signal to other signals.
\n
I apologize if the solution is hard to understand as I had to write it in a hurry.
\nI created a figure to illustrate what I’m doing more concretely.

Congratulations!
\nI’m always amazed at your speed of climbing the LB and your wonderful solution!
\nI would like to ask you the details of sigma estimation which is mentioned in the following sentence.
\n\nI adjusted a constant sigma to be estimated individually for each planet.
\n
I’m also curious of your source code, so I’ll appreciate it if you publish the notebook of your solution!
", "votes": 1, "replies": [ { "id": 3034427, "author_name": "yu4u", "author_url": "", "post_date": "2024-11-02T06:07:46.470000", "content": "Thank you for your interest in my solution.
\nI used scipy.optimize.curve_fit for 3d fitting, and then used the returned statistical information along with the estimated depth’s min, max, std, mean, etc., as inputs to a RandomForestRegressor to estimate the mean value of sigma.
\nSince it was a short-term challenge, the code is quite messy, but I've made the submission notebook public.
https://www.kaggle.com/code/ren4yu/ariel-2024-sub-ensemble
", "votes": 1, "replies": [ { "id": 3034442, "author_name": "moto", "author_url": "", "post_date": "2024-11-02T06:32:54.450000", "content": "Thank you very much for the reply!
\nI could understand your sigma estimation method well.
\nI’ll read the code for my better understanding.
Hi, may I ask what do you mean by
\n\n", "votes": 1, "replies": [ { "id": 3034437, "author_name": "yu4u", "author_url": "", "post_date": "2024-11-02T06:29:53.967000", "content": "Instead of optimizing the depth during three-dimensional plane fitting, normalize flux using the fitted signal and estimate the depth from the ratio of the average flux in transit phase signal to other signals.
\n
I apologize if the solution is hard to understand as I had to write it in a hurry.
\nI created a figure to illustrate what I’m doing more concretely.