\n

Thanks ARIEL team for hosting this competition it was a lot of fun.
\nAlso shoutout to all the amazing public notebooks. They were very helpful to get me started.
Short Summary:
\nNo Deep Learning
\nTransit depths were fitted using Sergei's polynomial regression method https://www.kaggle.com/code/sergeifironov/ariel-only-correlation.
\nTransit Detection
Predicting Mean Transit
\n-average wavelengths 0 to 240
\n-used gaussian filter on each region separately.
\n-averaged the prediction of polynomial fitting with deg 2 to deg 4. If there was too much curvature, I use deg 4 instead.
Basic data processing. They didn't affect cv at all, but gained me ~20 points on public/private leaderboard
\nPredict individual wavelengths
\n-Convolved the signal across wavelength axis with window size 20 to 60, based on the MAE of the signal. So, if the MAE is lower, I can afford to have a smaller convolution window.
Sigma (estimated by scaling off two components)
\n-based on the MAE of the residuals between fitted polynomial curve and unprocessed signal. This MAE is also normalized by the fitted curve so that it is in the same units as Transit Depth (percentage)
\n-based on the \"flatness\" of the spectra curve. The reason for this is I convolved the signals across wavelengths. So, the flat spectra curves estimates are going to have higher certainty.
Predicting flat curves
\nLink to code
\nhttps://www.kaggle.com/code/junglebeastds/ariel-data-challenge-2024-submission-v7?scriptVersionId=204717619
Thanks ARIEL team for hosting this competition it was a lot of fun.
\nAlso shoutout to all the amazing public notebooks. They were very helpful to get me started.
Short Summary:
\nNo Deep Learning
\nTransit depths were fitted using Sergei's polynomial regression method https://www.kaggle.com/code/sergeifironov/ariel-only-correlation.
\nTransit Detection
Predicting Mean Transit
\n-average wavelengths 0 to 240
\n-used gaussian filter on each region separately.
\n-averaged the prediction of polynomial fitting with deg 2 to deg 4. If there was too much curvature, I use deg 4 instead.
Basic data processing. They didn't affect cv at all, but gained me ~20 points on public/private leaderboard
\nPredict individual wavelengths
\n-Convolved the signal across wavelength axis with window size 20 to 60, based on the MAE of the signal. So, if the MAE is lower, I can afford to have a smaller convolution window.
Sigma (estimated by scaling off two components)
\n-based on the MAE of the residuals between fitted polynomial curve and unprocessed signal. This MAE is also normalized by the fitted curve so that it is in the same units as Transit Depth (percentage)
\n-based on the \"flatness\" of the spectra curve. The reason for this is I convolved the signals across wavelengths. So, the flat spectra curves estimates are going to have higher certainty.
Predicting flat curves
\nLink to code
\nhttps://www.kaggle.com/code/junglebeastds/ariel-data-challenge-2024-submission-v7?scriptVersionId=204717619
Good job, and congratulations on your gold medal achievement🥳!
\nYour impressive results achieved using purely signal processing techniques are remarkable, and your description of the approach is concise and effective. I am very eager to learn more and review the code for further understanding. Could you share more details?
Thanks.
\nI posted the code. I forgot to yesterday. I apologize for the messiness. Organization was thrown out the window to get my model online as fast as possible.
", "rawMarkdown": "Thanks.\n\nI posted the code. I forgot to yesterday. I apologize for the messiness. Organization was thrown out the window to get my model online as fast as possible.", "replies": [ { "id": 3035228, "postDate": "2024-11-03T06:50:50.450Z", "content": "Thank you for your generosity!
", "rawMarkdown": "Thank you for your generosity!" } ] } ] }, { "id": 3036248, "postDate": "2024-11-04T11:58:56.617Z", "content": "Congratulations on the 7th place finish, and thanks for sharing your solution details! super helpful for anyone learning from this competition! @junglebeastds
", "rawMarkdown": "Congratulations on the 7th place finish, and thanks for sharing your solution details! super helpful for anyone learning from this competition! @junglebeastds " } ], "comments": [ { "id": 3033427, "author_name": "Max2020", "author_url": "", "post_date": "2024-11-01T05:26:05.843000", "content": "Good job, and congratulations on your gold medal achievement🥳!
\nYour impressive results achieved using purely signal processing techniques are remarkable, and your description of the approach is concise and effective. I am very eager to learn more and review the code for further understanding. Could you share more details?
Thanks.
\nI posted the code. I forgot to yesterday. I apologize for the messiness. Organization was thrown out the window to get my model online as fast as possible.
", "votes": 0, "replies": [ { "id": 3035228, "author_name": "Max2020", "author_url": "", "post_date": "2024-11-03T06:50:50.450000", "content": "Thank you for your generosity!
", "votes": 0, "replies": [] } ] } ] }, { "id": 3036248, "author_name": "Rishan Hasan Tenis", "author_url": "", "post_date": "2024-11-04T11:58:56.617000", "content": "Congratulations on the 7th place finish, and thanks for sharing your solution details! super helpful for anyone learning from this competition! @junglebeastds
", "votes": 0, "replies": [] } ], "raw_markdown_by_id": { "3033265": "Thanks ARIEL team for hosting this competition it was a lot of fun.\nAlso shoutout to all the amazing public notebooks. They were very helpful to get me started.\n\nShort Summary:\nNo Deep Learning\nTransit depths were fitted using Sergei's polynomial regression method https://www.kaggle.com/code/sergeifironov/ariel-only-correlation.\n**Transit Detection**\n1. Compute first derivative over entire signal. Convolution window of 30 over the first derivative. Find the min and maxes, those are the two critical points. Then fit a polynomial and transit depth with a fixed ingress/egress window size.\n2. Count points from the critical points until the points get within 1-3 std of the fitted polynomial. This is a more precise estimate of the ingress/egress duration. I then proceed to find the transit using the updated transit regions.\n\n**Predicting Mean Transit**\n-average wavelengths 0 to 240\n-used gaussian filter on each region separately.\n-averaged the prediction of polynomial fitting with deg 2 to deg 4. If there was too much curvature, I use deg 4 instead.\n\n**Basic data processing.** They didn't affect cv at all, but gained me ~20 points on public/private leaderboard\n- Filled nan values using the average of symmetry across spatial column and interpolated flux between the two closet wavelengths (in cv interpolation method was way better, but worse in the public leaderboard)\n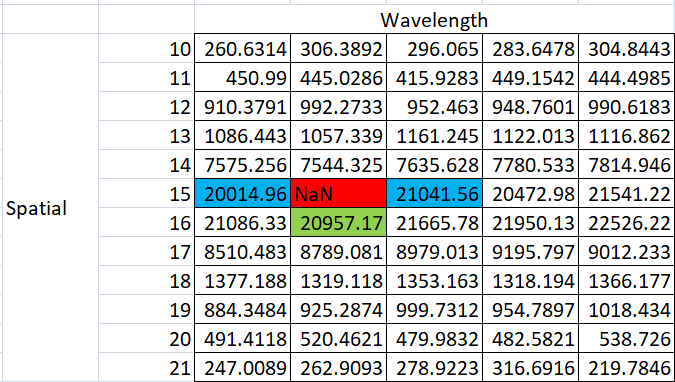\n\n\n**Predict individual wavelengths**\n-Convolved the signal across wavelength axis with window size 20 to 60, based on the MAE of the signal. So, if the MAE is lower, I can afford to have a smaller convolution window.\n- The individual wavelength predictions were shifted by the mean. And sometimes scaled down.\n\n**Sigma (estimated by scaling off two components)**\n-based on the MAE of the residuals between fitted polynomial curve and unprocessed signal. This MAE is also normalized by the fitted curve so that it is in the same units as Transit Depth (percentage)\n-based on the \"flatness\" of the spectra curve. The reason for this is I convolved the signals across wavelengths. So, the flat spectra curves estimates are going to have higher certainty.\n\n**Predicting flat curves**\n- I saw in the training data that most of the spectra curves were flat. So, I sought to predict whether the spectra curve was flat or not.\nIf it was, I predict the mean transit and set a very low std (also based on the two components I mentioned earlier).\n\nLink to code\nhttps://www.kaggle.com/code/junglebeastds/ariel-data-challenge-2024-submission-v7?scriptVersionId=204717619", "3033427": "Good job, and congratulations on your gold medal achievement🥳! \nYour impressive results achieved using purely signal processing techniques are remarkable, and your description of the approach is concise and effective. I am very eager to learn more and review the code for further understanding. Could you share more details?", "3036248": "Congratulations on the 7th place finish, and thanks for sharing your solution details! super helpful for anyone learning from this competition! @junglebeastds " } }