
In order to estimate sigma I decided to use the following idea:
1) You can remove a part of your spectrum (for example, wavelengths 0-25), and estimate the s value without the selected spectrum part (using the mean signal but you compute this mean signal excluding the selected wavelengths);
\n2) Estimate several values of s for one planet by sliding this window (I call it dark filter because it just removes a part of the spectrum), different windows do not overlap to make the computations faster;
\n3) Compute the standard deviation of s values;
\nFor a single planet it may look like (notice the brown curve - it corresponds to s estimations with different dark windows):
\n
4) Notice a strong correlation between std(s) and MSE (between true and predicted spectrum, the latter is just a constant):
\n
5) Fit a linear or a quantile regression to predict sigma:
= . * np.std(dark_filter_s) - .e-\n = max(sigma, e-)\n = min(sigma, e-)\n6) Use your mean and sigma (two numbers) for one planet. Also, you can scale them at different wavelengths using the prior distribution.
\nP.S. Thanks to the host team for this interesting competition, and congratulations to the winners!
", "messages": [ { "id": 3033316, "postDate": "2024-11-01T01:37:46.293Z", "content": "In order to estimate sigma I decided to use the following idea:
1) You can remove a part of your spectrum (for example, wavelengths 0-25), and estimate the s value without the selected spectrum part (using the mean signal but you compute this mean signal excluding the selected wavelengths);
\n2) Estimate several values of s for one planet by sliding this window (I call it dark filter because it just removes a part of the spectrum), different windows do not overlap to make the computations faster;
\n3) Compute the standard deviation of s values;
\nFor a single planet it may look like (notice the brown curve - it corresponds to s estimations with different dark windows):
\n
4) Notice a strong correlation between std(s) and MSE (between true and predicted spectrum, the latter is just a constant):
\n
5) Fit a linear or a quantile regression to predict sigma:
= . * np.std(dark_filter_s) - .e-\n = max(sigma, e-)\n = min(sigma, e-)\n6) Use your mean and sigma (two numbers) for one planet. Also, you can scale them at different wavelengths using the prior distribution.
\nP.S. Thanks to the host team for this interesting competition, and congratulations to the winners!
", "rawMarkdown": "In order to estimate `sigma` I decided to use the following idea:\n\n1) You can remove a part of your spectrum (for example, wavelengths 0-25), and estimate the **s** value without the selected spectrum part (using the mean signal but you compute this mean signal excluding the selected wavelengths);\n\n2) Estimate several values of **s** for one planet by sliding this window (I call it *dark filter* because it just removes a part of the spectrum), different windows do not overlap to make the computations faster;\n\n3) Compute the standard deviation of **s** values;\n\nFor a single planet it may look like (notice the brown curve - it corresponds to **s** estimations with different dark windows):\n\n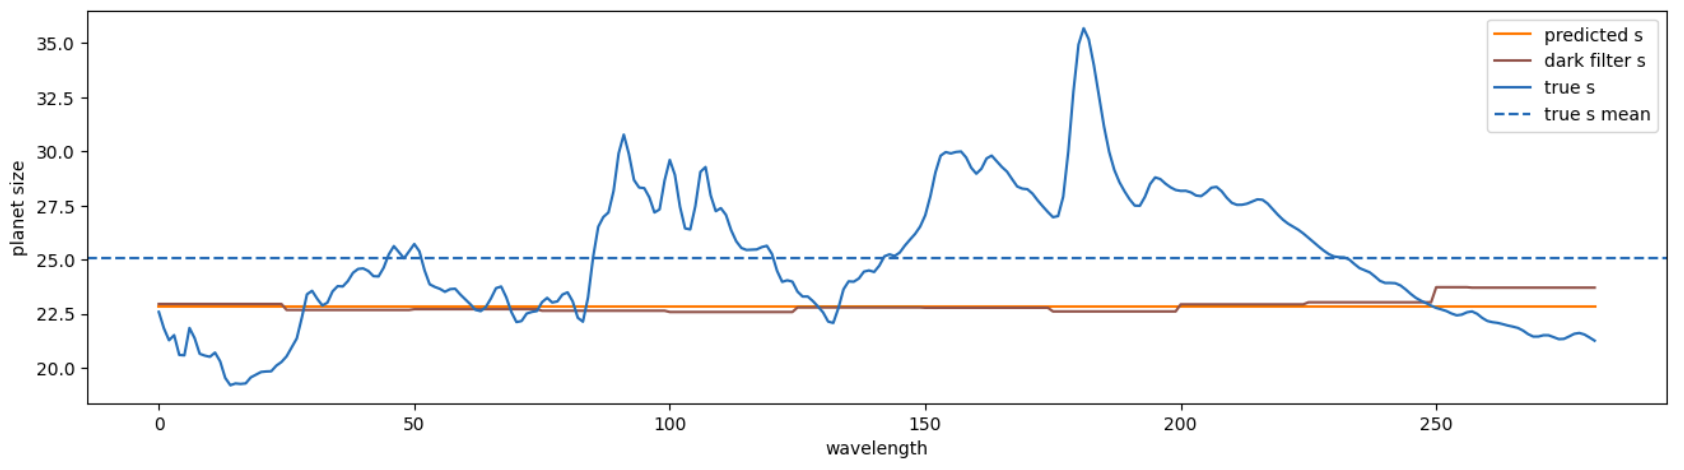\n\n4) Notice a strong correlation between std(**s**) and MSE (between true and predicted spectrum, the latter is just a constant):\n\n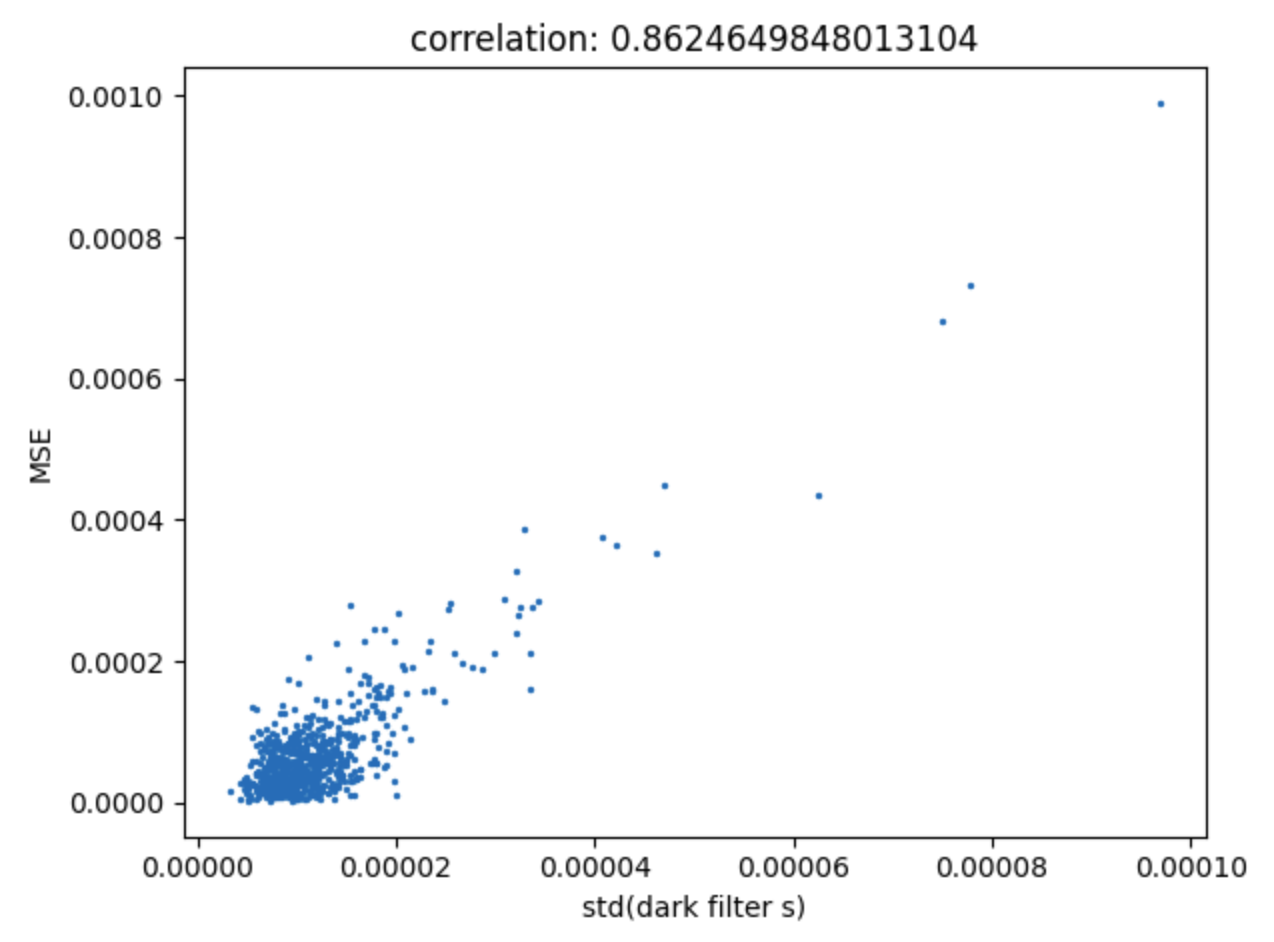\n\n5) Fit a linear or a quantile regression to predict `sigma`:\n\n```\nsigma = 10.0 * np.std(dark_filter_s) - 1.4e-5\nsigma = max(sigma, 6e-5)\nsigma = min(sigma, 1e-3)\n```\n\n6) Use your mean and sigma (two numbers) for one planet. Also, you can scale them at different wavelengths using the prior distribution.\n\nP.S. Thanks to the host team for this interesting competition, and congratulations to the winners!", "votes": 13 } ], "comments": [], "raw_markdown_by_id": { "3033316": "In order to estimate `sigma` I decided to use the following idea:\n\n1) You can remove a part of your spectrum (for example, wavelengths 0-25), and estimate the **s** value without the selected spectrum part (using the mean signal but you compute this mean signal excluding the selected wavelengths);\n\n2) Estimate several values of **s** for one planet by sliding this window (I call it *dark filter* because it just removes a part of the spectrum), different windows do not overlap to make the computations faster;\n\n3) Compute the standard deviation of **s** values;\n\nFor a single planet it may look like (notice the brown curve - it corresponds to **s** estimations with different dark windows):\n\n\n\n4) Notice a strong correlation between std(**s**) and MSE (between true and predicted spectrum, the latter is just a constant):\n\n\n\n5) Fit a linear or a quantile regression to predict `sigma`:\n\n```\nsigma = 10.0 * np.std(dark_filter_s) - 1.4e-5\nsigma = max(sigma, 6e-5)\nsigma = min(sigma, 1e-3)\n```\n\n6) Use your mean and sigma (two numbers) for one planet. Also, you can scale them at different wavelengths using the prior distribution.\n\nP.S. Thanks to the host team for this interesting competition, and congratulations to the winners!" } }