
When I entered this competition, I began with a classical fitting approach for signal reconstruction. Surprisingly, it performed very well compared to other models I tested. This approach has several advantages: it is stable in noisy data, relatively simple to implement, and offers a way to construct reliable confidence intervals.
\nThe method consists of two main steps: data detrending and transit model fitting.
\nData detrending:
\nIn this step, we identify transit breakpoints, mask the transit phase, and fit a quadratic polynomial to the remaining data. This parametrization provides a model that describes the star’s flux in absence of a planetary transit. The detrended data from this model is used in the next step (see figure).
Transit parametrization using the Erf function:
\nI found the error function is great for catching the transition zones and offers an estimate of transit depth via its vertical offset. The fitted model consists of two error functions with opposite signs, representing the ingress and egress of the transit. It is quite stable even if the detrending of data is not perfect. The fit errors are scaled to ensure that the confidence intervals cover approximately 99% of cases
The next step is about testing sensitivity to the spectrum.
\nChoice of wavelength steps:
\nPredicting the transit depth at every individual wavelength point can be noisy, so two scenarios were considered for predictions:
\n1) Merging data by averaging every 15 wavelength values
\n2) Using a single, wavelength-inclusive result for cases with low sensitivity.
\nIf both scenarios align within a specific p-value threshold, I use the wavelength-inclusive result (2) for prediction. Otherwise, I rely on the merged data scenario (1).
When I entered this competition, I began with a classical fitting approach for signal reconstruction. Surprisingly, it performed very well compared to other models I tested. This approach has several advantages: it is stable in noisy data, relatively simple to implement, and offers a way to construct reliable confidence intervals.
\nThe method consists of two main steps: data detrending and transit model fitting.
\nData detrending:
\nIn this step, we identify transit breakpoints, mask the transit phase, and fit a quadratic polynomial to the remaining data. This parametrization provides a model that describes the star’s flux in absence of a planetary transit. The detrended data from this model is used in the next step (see figure).
Transit parametrization using the Erf function:
\nI found the error function is great for catching the transition zones and offers an estimate of transit depth via its vertical offset. The fitted model consists of two error functions with opposite signs, representing the ingress and egress of the transit. It is quite stable even if the detrending of data is not perfect. The fit errors are scaled to ensure that the confidence intervals cover approximately 99% of cases
The next step is about testing sensitivity to the spectrum.
\nChoice of wavelength steps:
\nPredicting the transit depth at every individual wavelength point can be noisy, so two scenarios were considered for predictions:
\n1) Merging data by averaging every 15 wavelength values
\n2) Using a single, wavelength-inclusive result for cases with low sensitivity.
\nIf both scenarios align within a specific p-value threshold, I use the wavelength-inclusive result (2) for prediction. Otherwise, I rely on the merged data scenario (1).
Thank you for sharing amazing approach!
\nThe merging policy with p-value is so smart :)
Can I ask you how did you identify transit breakpoints in the detrending process?
\nBy chance, do you share your code in the future?
Thanks! :)
\nRegarding the breakpoints I relied on the function shared by @ilu000 (see this discussion). It was not super accurate for some planets but sufficient for the data-detrending step. One reason for fitting with the Erf function was to improve the finding of breakpoints that could be input into a more sophisticated approach. Interestingly, together with the breakpoints, it provided quite a reliable estimate of the transition depth.
I made my submission notebook public, it can be found here: submission notebook.
", "rawMarkdown": "Thanks! :)\nRegarding the breakpoints I relied on the function shared by @ilu000 (see this [discussion](https://www.kaggle.com/competitions/ariel-data-challenge-2024/discussion/529533)). It was not super accurate for some planets but sufficient for the data-detrending step. One reason for fitting with the `Erf` function was to improve the finding of breakpoints that could be input into a more sophisticated approach. Interestingly, together with the breakpoints, it provided quite a reliable estimate of the transition depth.\n\nI made my submission notebook public, it can be found here: [submission notebook](https://www.kaggle.com/code/olehkivernyk/parametric-fits-17th-place)." } ] }, { "id": 3033822, "postDate": "2024-11-01T14:50:06.757Z", "content": "Nice rigorous approach with Erf function
", "rawMarkdown": "Nice rigorous approach with Erf function", "votes": 2 } ], "comments": [ { "id": 3034550, "author_name": "kyu999", "author_url": "", "post_date": "2024-11-02T09:18:21.470000", "content": "Thank you for sharing amazing approach!
\nThe merging policy with p-value is so smart :)
Can I ask you how did you identify transit breakpoints in the detrending process?
\nBy chance, do you share your code in the future?
Thanks! :)
\nRegarding the breakpoints I relied on the function shared by @ilu000 (see this discussion). It was not super accurate for some planets but sufficient for the data-detrending step. One reason for fitting with the Erf function was to improve the finding of breakpoints that could be input into a more sophisticated approach. Interestingly, together with the breakpoints, it provided quite a reliable estimate of the transition depth.
I made my submission notebook public, it can be found here: submission notebook.
", "votes": 0, "replies": [] } ] }, { "id": 3033822, "author_name": "kubba123", "author_url": "", "post_date": "2024-11-01T14:50:06.757000", "content": "Nice rigorous approach with Erf function
", "votes": 2, "replies": [] } ], "raw_markdown_by_id": { "3033593": "When I entered this competition, I began with a classical fitting approach for signal reconstruction. Surprisingly, it performed very well compared to other models I tested. This approach has several advantages: it is stable in noisy data, relatively simple to implement, and offers a way to construct reliable confidence intervals.\n\nThe method consists of two main steps: data detrending and transit model fitting.\n\n**Data detrending:**\nIn this step, we identify transit breakpoints, mask the transit phase, and fit a quadratic polynomial to the remaining data. This parametrization provides a model that describes the star’s flux in absence of a planetary transit. The detrended data from this model is used in the next step (see figure).\n\n**Transit parametrization using the `Erf` function:**\nI found the error function is great for catching the transition zones and offers an estimate of transit depth via its vertical offset. The fitted model consists of two error functions with opposite signs, representing the ingress and egress of the transit. It is quite stable even if the detrending of data is not perfect. The fit errors are scaled to ensure that the confidence intervals cover approximately 99% of cases\n\n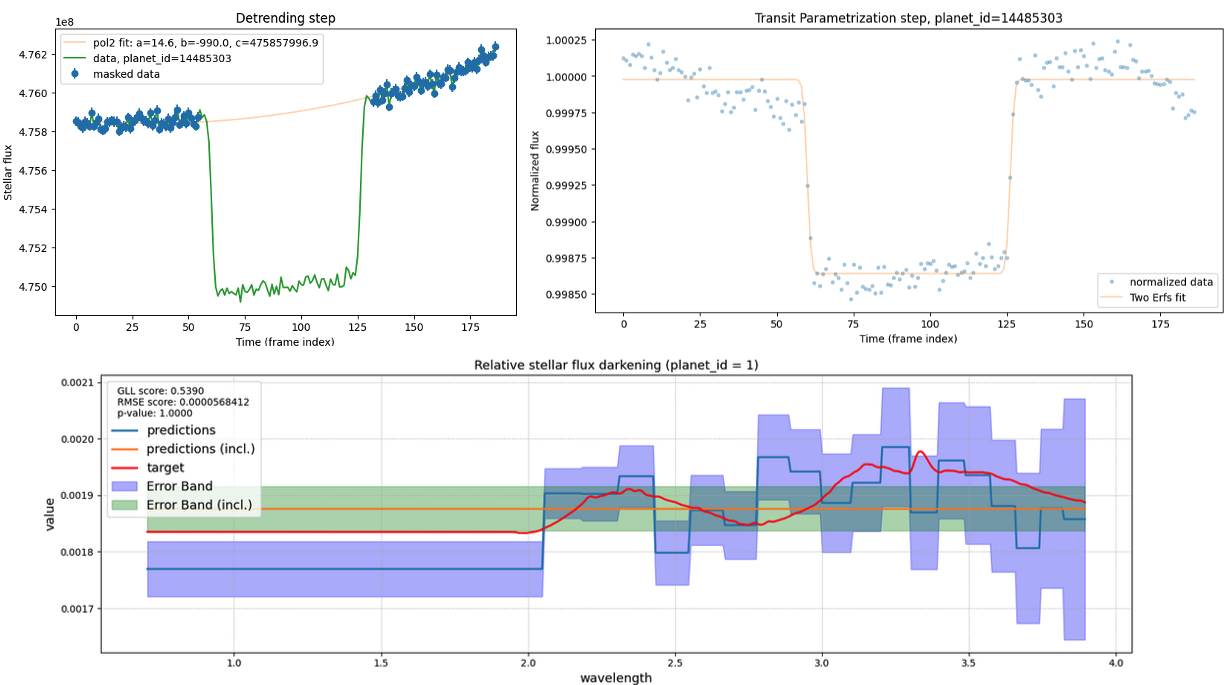\n\nThe next step is about testing sensitivity to the spectrum.\n\n**Choice of wavelength steps:**\nPredicting the transit depth at every individual wavelength point can be noisy, so two scenarios were considered for predictions:\n1) Merging data by averaging every 15 wavelength values\n2) Using a single, wavelength-inclusive result for cases with low sensitivity.\nIf both scenarios align within a specific p-value threshold, I use the wavelength-inclusive result (2) for prediction. Otherwise, I rely on the merged data scenario (1).", "3034550": "Thank you for sharing amazing approach!\nThe merging policy with p-value is so smart :)\n\nCan I ask you how did you identify transit breakpoints in the detrending process?\nBy chance, do you share your code in the future?", "3033822": "Nice rigorous approach with Erf function" } }