
A huge thank you to the organizers for this truly inspiring competition! We wish the Ariel mission and team all the best!
\nOur solution is structured into four main stages:
\nThe corresponding code is available in this notebook: https://www.kaggle.com/code/skril31/adc-2024-space-coders
\nEach stage is described in detail below. The total computation time on the test set is approximately 1.5 hours, utilizing 4 CPU processes.
\nCalibration and spatial summation
\nThis step mainly reflects the calibration process proposed by the organizers (calibration notebook), with a few modifications aimed at enhancing the signal-to-noise ratio:
\nWeighting and dead pixel mitigation
\nThe data is weighted to prioritize wavelengths with higher SNR during spectral axis averaging. For each wavelength, the weight is calculated as the ratio of the mean of the out-of-transit signal to its variance.
\n
In addition, to mitigate the impact of dead pixels on transit depth reconstruction, we apply a penalty factor to the weight of AIRS wavelengths when a dead pixel is present. The penalty varies based on the dead pixel's location, with larger penalties applied to central pixels that are more likely to affect the transit depth.
\nWe tried to apply penalty factors also for hot pixels but it degraded performance.
This stage focuses on estimating the (Rp/Rs)² ratio for each wavelength from preprocessed data.
\nDetrending and estimation of the transit depth
\nThe computation of the transit depth is based on a polynomial fitting of the temporal signal up to a degree 5, excluding ingress and egress transitions, with a multiplicative shift applied to the in-transit portion.
\nWe use scipy.optimize.curve_fit with the following model function and a high uncertainty sigma on the transitions:
(): \n (trending_coeffs)(ts)* (. - transit_mask * transit_depth) \nAveraging over wavelengths
\nTo reduce noise, the optimization is applied to the average of the weighted signal over neighboring wavelengths [k - N, k + N] for AIRS (including the extra wavelengths out of the 282 targets). As a compromise between noise reduction and loss of precision due to spectral averaging, we selected N = 8 for the first 200 wavelengths, and N = 20 for the last wavelengths where SNR is very low and the spectrum dynamics apparently lower.
\nDetermination of ingress and egress transitions
\nTransitions are detected via convolutions with the first two derivatives of a Gaussian:
\n
Improvements on spectrum extraction
\nDegree selection:
\nWe successively evaluate degrees 2, 4, and 5, selecting the one with the best RMS error, penalized with the square of the degree. A savgol filter is applied to each segment outside transitions to ensure representative RMS differences.
\nThis degree selection reduced the risk of overfitting noise in the transit area, that would degrade transit depth estimation.
\nIn addition, it proved useful to cap the maximum degree to the one selected for a first overall signal evaluation.
Global detrending and estimation on a narrow wavelength range:
\nA final boost in precision and score, allowing us to go past 0.700 on the leaderboard (LB) on the last few days, consisted on first evaluating a more reliable detrending polynomial on a wider range of wavelengths (up to 100 on each side), and keep this polynomial in a subsequent optimization on the initial range with only 3 parameters: an offset and a magnitude factor and the researched transit depth.
\nA narrower range of N = 5 instead of N = 8 is also considered around wavelength 183 for stars 0 and 1 (CH4 peak).

This stage involves empirical heuristics and rule-based adjustments.
\nSpectrum dynamics consideration
\nThe main feature that enabled us to reach LB 0.65 was to segregate the post-processing and sigma estimation of a spectrum in function of its dynamics.
\nWe initially based the determination of the dynamics on the extent of the (Rp/Rs)² ratio. We then switched to an evaluation of the best correlation with the training set labels. In our final submissions, we included additional Taurex-generated samples with random chemistries (+0.005 on private LB).
\nAnother modification we performed to increase the score was to slightly distort the average line in the direction of the raw spectrum (proportional to the degree of correlation).
Offset correction
\nWe then reached LB 0.68 by slightly increasing the spectrum values in function of the average Rp/Rs ratio. We first assumed this was necessary to counter the effect of limb darkening, but this is most likely needed to counter not so representative starts and ends of transitions (with a detection step not capturing the early changes of slope when the planet starts to enter or exit the limb of the star).
\n[edit: it might indeed be linked to the added foreground, as presented by @cnumber in https://www.kaggle.com/competitions/ariel-data-challenge-2024/discussion/543853#3034316 ]
Spectrum adaptations
\nAfter application of a savgol filter and offset correction, additional tweaks are performed:
Sigma estimation
\nSigma varies with wavelength. It is empirically constructed, considering higher sigma for deeper transits and for values that are farther from the mean. Two different sets of parameters are used based on the identified spectrum dynamics (low / high).
\nOnce the per-planet processing is complete, principal component analysis (PCA) is applied to refine the spectra, removing residual noise and artifacts. This step, applied per star keeping the first 5 components for reprojection, reduces RMSE from 4.3e-5 to 3.3e-5 on the training set and increases LB score by 0.015.
\n
A huge thank you to the organizers for this truly inspiring competition! We wish the Ariel mission and team all the best!
\nOur solution is structured into four main stages:
\nThe corresponding code is available in this notebook: https://www.kaggle.com/code/skril31/adc-2024-space-coders
\nEach stage is described in detail below. The total computation time on the test set is approximately 1.5 hours, utilizing 4 CPU processes.
\nCalibration and spatial summation
\nThis step mainly reflects the calibration process proposed by the organizers (calibration notebook), with a few modifications aimed at enhancing the signal-to-noise ratio:
\nWeighting and dead pixel mitigation
\nThe data is weighted to prioritize wavelengths with higher SNR during spectral axis averaging. For each wavelength, the weight is calculated as the ratio of the mean of the out-of-transit signal to its variance.
\n
In addition, to mitigate the impact of dead pixels on transit depth reconstruction, we apply a penalty factor to the weight of AIRS wavelengths when a dead pixel is present. The penalty varies based on the dead pixel's location, with larger penalties applied to central pixels that are more likely to affect the transit depth.
\nWe tried to apply penalty factors also for hot pixels but it degraded performance.
This stage focuses on estimating the (Rp/Rs)² ratio for each wavelength from preprocessed data.
\nDetrending and estimation of the transit depth
\nThe computation of the transit depth is based on a polynomial fitting of the temporal signal up to a degree 5, excluding ingress and egress transitions, with a multiplicative shift applied to the in-transit portion.
\nWe use scipy.optimize.curve_fit with the following model function and a high uncertainty sigma on the transitions:
(): \n (trending_coeffs)(ts)* (. - transit_mask * transit_depth) \nAveraging over wavelengths
\nTo reduce noise, the optimization is applied to the average of the weighted signal over neighboring wavelengths [k - N, k + N] for AIRS (including the extra wavelengths out of the 282 targets). As a compromise between noise reduction and loss of precision due to spectral averaging, we selected N = 8 for the first 200 wavelengths, and N = 20 for the last wavelengths where SNR is very low and the spectrum dynamics apparently lower.
\nDetermination of ingress and egress transitions
\nTransitions are detected via convolutions with the first two derivatives of a Gaussian:
\n
Improvements on spectrum extraction
\nDegree selection:
\nWe successively evaluate degrees 2, 4, and 5, selecting the one with the best RMS error, penalized with the square of the degree. A savgol filter is applied to each segment outside transitions to ensure representative RMS differences.
\nThis degree selection reduced the risk of overfitting noise in the transit area, that would degrade transit depth estimation.
\nIn addition, it proved useful to cap the maximum degree to the one selected for a first overall signal evaluation.
Global detrending and estimation on a narrow wavelength range:
\nA final boost in precision and score, allowing us to go past 0.700 on the leaderboard (LB) on the last few days, consisted on first evaluating a more reliable detrending polynomial on a wider range of wavelengths (up to 100 on each side), and keep this polynomial in a subsequent optimization on the initial range with only 3 parameters: an offset and a magnitude factor and the researched transit depth.
\nA narrower range of N = 5 instead of N = 8 is also considered around wavelength 183 for stars 0 and 1 (CH4 peak).
This stage involves empirical heuristics and rule-based adjustments.
\nSpectrum dynamics consideration
\nThe main feature that enabled us to reach LB 0.65 was to segregate the post-processing and sigma estimation of a spectrum in function of its dynamics.
\nWe initially based the determination of the dynamics on the extent of the (Rp/Rs)² ratio. We then switched to an evaluation of the best correlation with the training set labels. In our final submissions, we included additional Taurex-generated samples with random chemistries (+0.005 on private LB).
\nAnother modification we performed to increase the score was to slightly distort the average line in the direction of the raw spectrum (proportional to the degree of correlation).
Offset correction
\nWe then reached LB 0.68 by slightly increasing the spectrum values in function of the average Rp/Rs ratio. We first assumed this was necessary to counter the effect of limb darkening, but this is most likely needed to counter not so representative starts and ends of transitions (with a detection step not capturing the early changes of slope when the planet starts to enter or exit the limb of the star).
\n[edit: it might indeed be linked to the added foreground, as presented by @cnumber in https://www.kaggle.com/competitions/ariel-data-challenge-2024/discussion/543853#3034316 ]
Spectrum adaptations
\nAfter application of a savgol filter and offset correction, additional tweaks are performed:
Sigma estimation
\nSigma varies with wavelength. It is empirically constructed, considering higher sigma for deeper transits and for values that are farther from the mean. Two different sets of parameters are used based on the identified spectrum dynamics (low / high).
\nOnce the per-planet processing is complete, principal component analysis (PCA) is applied to refine the spectra, removing residual noise and artifacts. This step, applied per star keeping the first 5 components for reprojection, reduces RMSE from 4.3e-5 to 3.3e-5 on the training set and increases LB score by 0.015.
\n
The PCA is amazing idea. Really cool and far from trivial. Kudos for finding it!
", "rawMarkdown": "The PCA is amazing idea. Really cool and far from trivial. Kudos for finding it!", "votes": 1, "replies": [ { "id": 3034633, "postDate": "2024-11-02T12:25:42.623Z", "content": "Thank you! Credit goes to @vdebout who found it :-)
", "rawMarkdown": "Thank you! Credit goes to @vdebout who found it :-)", "votes": 1, "replies": [ { "id": 3034674, "postDate": "2024-11-02T13:00:25.520Z", "content": "Yes, I thought about applying PCA to the training set, but I didn't think it would generalize to the test data. You (or Vincent) applied it to the test data prediction. Amazing! Congratulations!
", "rawMarkdown": "Yes, I thought about applying PCA to the training set, but I didn't think it would generalize to the test data. You (or Vincent) applied it to the test data prediction. Amazing! Congratulations!" } ] } ] }, { "id": 3037719, "postDate": "2024-11-06T03:43:27.187Z", "content": "The corresponding code is now available in this notebook: https://www.kaggle.com/code/skril31/adc-2024-space-coders
", "rawMarkdown": "The corresponding code is now available in this notebook: https://www.kaggle.com/code/skril31/adc-2024-space-coders" }, { "id": 3036449, "postDate": "2024-11-04T15:04:37.880Z", "content": "That's Amazing.
", "rawMarkdown": "That's Amazing." } ], "comments": [ { "id": 3034626, "author_name": "greySnow", "author_url": "", "post_date": "2024-11-02T12:06:02.043000", "content": "The PCA is amazing idea. Really cool and far from trivial. Kudos for finding it!
", "votes": 1, "replies": [ { "id": 3034633, "author_name": "Skril", "author_url": "", "post_date": "2024-11-02T12:25:42.623000", "content": "Thank you! Credit goes to @vdebout who found it :-)
", "votes": 1, "replies": [ { "id": 3034674, "author_name": "🐢 Jun Koda", "author_url": "", "post_date": "2024-11-02T13:00:25.520000", "content": "Yes, I thought about applying PCA to the training set, but I didn't think it would generalize to the test data. You (or Vincent) applied it to the test data prediction. Amazing! Congratulations!
", "votes": 0, "replies": [] } ] } ] }, { "id": 3037719, "author_name": "Skril", "author_url": "", "post_date": "2024-11-06T03:43:27.187000", "content": "The corresponding code is now available in this notebook: https://www.kaggle.com/code/skril31/adc-2024-space-coders
", "votes": 0, "replies": [] }, { "id": 3036449, "author_name": "Humayra Khanom Rime", "author_url": "", "post_date": "2024-11-04T15:04:37.880000", "content": "That's Amazing.
", "votes": 0, "replies": [] } ], "raw_markdown_by_id": { "3034610": "A huge thank you to the organizers for this truly inspiring competition! We wish the Ariel mission and team all the best!\n\nOur solution is structured into four main stages:\n1. Data preprocessing\n2. Extraction of raw spectrum values\n3. Spectrum postprocessing and sigma estimation\n4. Final spectra refinement using PCA\n\nThe corresponding code is available in this notebook: https://www.kaggle.com/code/skril31/adc-2024-space-coders\n\nEach stage is described in detail below. The total computation time on the test set is approximately 1.5 hours, utilizing 4 CPU processes.\n\n## 1. Data preprocessing\n\n**Calibration and spatial summation**\n\nThis step mainly reflects the calibration process proposed by the organizers ([calibration notebook](https://www.kaggle.com/code/gordonyip/update-calibrating-and-binning-astronomical-data)), with a few modifications aimed at enhancing the signal-to-noise ratio:\n* Hot pixels are retained to prevent potential information loss, under the assumption that their signals remain valuable post dark correction.\n* Only the top 50% of pixels with the highest intensity values are considered, which helped reduce noise by approximately 4%.\n* Binning is reduced to 12 for AIRS-CH0 (and 144 for FGS1).\n\n**Weighting and dead pixel mitigation**\n\nThe data is weighted to prioritize wavelengths with higher SNR during spectral axis averaging. For each wavelength, the weight is calculated as the ratio of the mean of the out-of-transit signal to its variance. \n\n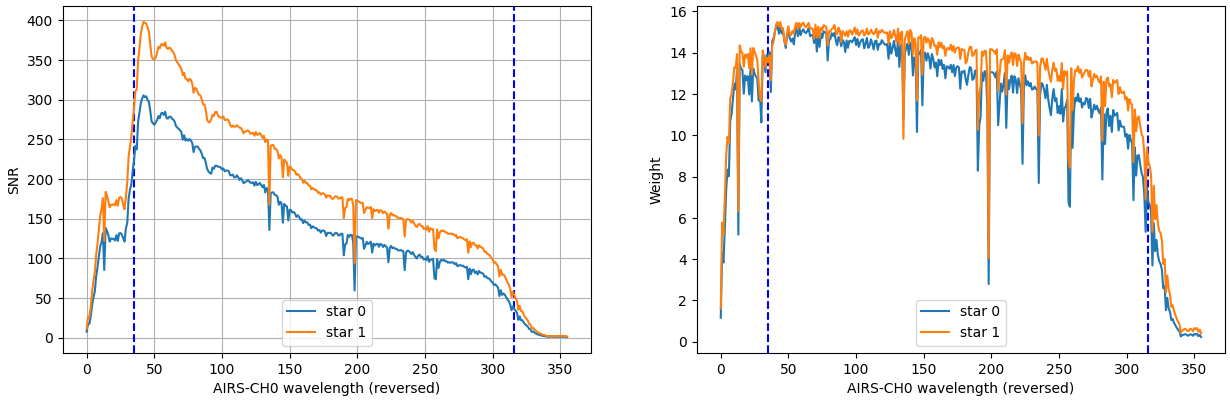\n\nIn addition, to mitigate the impact of dead pixels on transit depth reconstruction, we apply a penalty factor to the weight of AIRS wavelengths when a dead pixel is present. The penalty varies based on the dead pixel's location, with larger penalties applied to central pixels that are more likely to affect the transit depth. \nWe tried to apply penalty factors also for hot pixels but it degraded performance.\n\n## 2. Extraction of raw spectrum values\n\nThis stage focuses on estimating the (Rp/Rs)² ratio for each wavelength from preprocessed data.\n\n**Detrending and estimation of the transit depth**\n\nThe computation of the transit depth is based on a polynomial fitting of the temporal signal up to a degree 5, excluding ingress and egress transitions, with a multiplicative shift applied to the in-transit portion.\nWe use `scipy.optimize.curve_fit` with the following model function and a high uncertainty `sigma` on the transitions:\n\n```\ndef fit_fn(ts, transit_depth, *trending_coeffs): \n\treturn Polynomial(trending_coeffs)(ts)* (1. - transit_mask * transit_depth) \n```\n\n**Averaging over wavelengths**\n\nTo reduce noise, the optimization is applied to the average of the weighted signal over neighboring wavelengths [*k* - *N*, *k* + *N*] for AIRS (including the extra wavelengths out of the 282 targets). As a compromise between noise reduction and loss of precision due to spectral averaging, we selected *N* = 8 for the first 200 wavelengths, and *N* = 20 for the last wavelengths where SNR is very low and the spectrum dynamics apparently lower.\n\n**Determination of ingress and egress transitions**\n\nTransitions are detected via convolutions with the first two derivatives of a Gaussian:\n- Centers are identified as extrema of the convolution with the first Gaussian derivative.\n- Edges are approximated from surrounding extrema of the convolution with the second Gaussian derivative.\n\n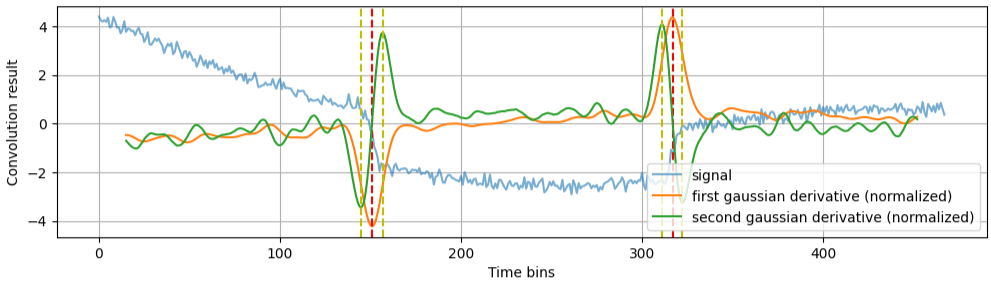\n\n**Improvements on spectrum extraction**\n\n- Degree selection:\nWe successively evaluate degrees 2, 4, and 5, selecting the one with the best RMS error, penalized with the square of the degree. A `savgol` filter is applied to each segment outside transitions to ensure representative RMS differences. \nThis degree selection reduced the risk of overfitting noise in the transit area, that would degrade transit depth estimation. \nIn addition, it proved useful to cap the maximum degree to the one selected for a first overall signal evaluation.\n\n- Global detrending and estimation on a narrow wavelength range:\nA final boost in precision and score, allowing us to go past 0.700 on the leaderboard (LB) on the last few days, consisted on first evaluating a more reliable detrending polynomial on a wider range of wavelengths (up to 100 on each side), and keep this polynomial in a subsequent optimization on the initial range with only 3 parameters: an offset and a magnitude factor and the researched transit depth. \nA narrower range of *N* = 5 instead of *N* = 8 is also considered around wavelength 183 for stars 0 and 1 (CH4 peak).\n\n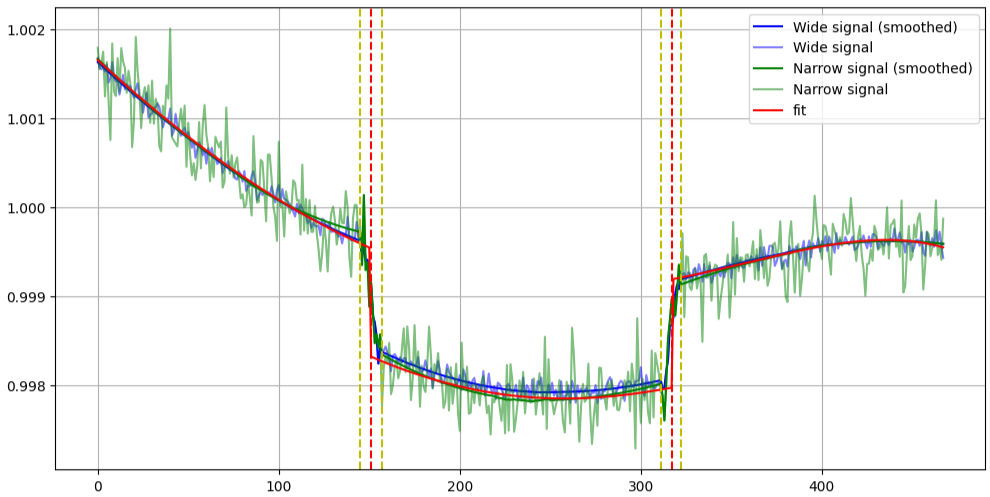\n\n## 3. Spectrum postprocessing and sigma estimation\n\nThis stage involves empirical heuristics and rule-based adjustments.\n\n**Spectrum dynamics consideration**\n\nThe main feature that enabled us to reach LB 0.65 was to segregate the post-processing and sigma estimation of a spectrum in function of its dynamics.\n* For low dynamics (75% of transits), an average prediction line is applied.\n* For high dynamics, the raw spectrum is retained but adapted.\n\nWe initially based the determination of the dynamics on the extent of the (Rp/Rs)² ratio. We then switched to an evaluation of the best correlation with the training set labels. In our final submissions, we included additional Taurex-generated samples with random chemistries (+0.005 on private LB). \nAnother modification we performed to increase the score was to slightly distort the average line in the direction of the raw spectrum (proportional to the degree of correlation).\n\n**Offset correction**\n\nWe then reached LB 0.68 by slightly increasing the spectrum values in function of the average Rp/Rs ratio. We first assumed this was necessary to counter the effect of limb darkening, but this is most likely needed to counter not so representative starts and ends of transitions (with a detection step not capturing the early changes of slope when the planet starts to enter or exit the limb of the star). \n*[edit: it might indeed be linked to the added foreground, as presented by @cnumber in https://www.kaggle.com/competitions/ariel-data-challenge-2024/discussion/543853#3034316 ]*\n\n**Spectrum adaptations**\n\nAfter application of a `savgol` filter and offset correction, additional tweaks are performed:\n* Clipping envelope, e.g., -1. * std in the middle of the spectrum.\n* Replacing the final portion with a linear ramp except for star 0. \n\n**Sigma estimation**\n\nSigma varies with wavelength. It is empirically constructed, considering higher sigma for deeper transits and for values that are farther from the mean. Two different sets of parameters are used based on the identified spectrum dynamics (low / high).\n\n\n## 4. Final spectra refinement using PCA\n\nOnce the per-planet processing is complete, principal component analysis (PCA) is applied to refine the spectra, removing residual noise and artifacts. This step, applied per star keeping the first 5 components for reprojection, reduces RMSE from 4.3e-5 to 3.3e-5 on the training set and increases LB score by 0.015.\n\n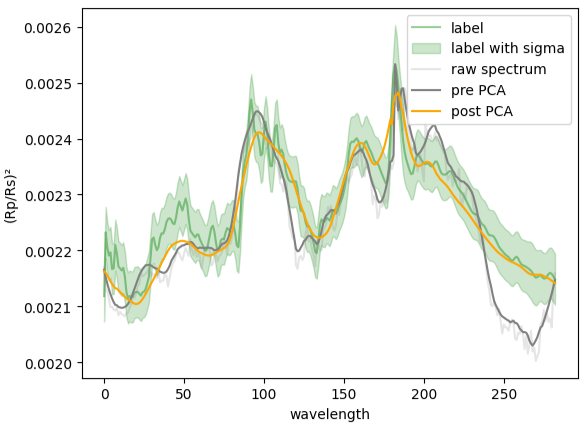\n\n\n## What didn't work: \n* Direct modeling of ingress/egress transitions during curve fitting.\n* Incorporating quadratic limb darkening.\n* Using a global detrending polynomial, which introduced linear drift in some spectra.\n* Using machine learning to estimate sigma based on raw and final spectra. ", "3034626": "The PCA is amazing idea. Really cool and far from trivial. Kudos for finding it!", "3037719": "The corresponding code is now available in this notebook: https://www.kaggle.com/code/skril31/adc-2024-space-coders", "3036449": "That's Amazing." } }