{"cells":[{"metadata":{},"cell_type":"markdown","source":"# PANDA dataset - getting started\nObtained from [various public notebooks](https://www.kaggle.com/c/prostate-cancer-grade-assessment/notebooks) in PANDA project. **Thank you for sharing your experience!**"},{"metadata":{"trusted":true},"cell_type":"code","source":"import os\n# Open images with OpenSlide\nimport openslide\n\n# General packages\nimport pandas as pd\nimport numpy as np\nimport matplotlib\nimport matplotlib.pyplot as plt\nimport PIL\nfrom IPython.display import display, FileLink, HTML","execution_count":null,"outputs":[]},{"metadata":{"trusted":true},"cell_type":"code","source":"# Location of the training images\ndata_dir = '/kaggle/input/prostate-cancer-grade-assessment/train_images'\nmask_dir = '/kaggle/input/prostate-cancer-grade-assessment/train_label_masks'\n\n# Location of training labels\ntrain = pd.read_csv('/kaggle/input/prostate-cancer-grade-assessment/train.csv').set_index('image_id')\ntest = pd.read_csv('/kaggle/input/prostate-cancer-grade-assessment/test.csv').set_index('image_id')\n\ntrain_images = os.listdir(data_dir)\ntrain_masks = os.listdir(mask_dir)\n\nprint('Number of images: ', len(train))\nprint('Number of masks: ', len(train))\nprint('Shape of the training data: ', train.shape)\nprint('Shape of the test data: ', test.shape)\n\ndisplay(train.head(8))\ndisplay(test.head())","execution_count":null,"outputs":[]},{"metadata":{},"cell_type":"markdown","source":"# Interactive viewer for slides\n\nWant to investigate slides locally on your machine? Using a WSI viewer you can interactively view the slides on your own machine. Examples of open source viewers that can open the PANDA dataset are [ASAP](https://github.com/computationalpathologygroup/ASAP/releases) and [QuPath](https://github.com/qupath/qupath/releases). ASAP can also overlay the masks on top of the images using the \"Overlay\" functionality. If you use Qupath, and the images do not load, try changing the file extension to `.vtif`."},{"metadata":{},"cell_type":"markdown","source":"# Palette for masks"},{"metadata":{"trusted":true},"cell_type":"code","source":"import IPython.display\nimport PIL.Image\n\npalette_radboud = [0, 0, 0, 0.5, 0.5, 0.5, 0, 1, 0, 1, 1, 0.7, 1, 0.5, 0, 1, 0, 0]\npalette_karolinska = [0, 0, 0, 0.5, 0.5, 0.5, 1, 0, 0]\n\na = np.zeros( (100, 100, 3), dtype=np.uint8)\n\na[:,:] = (np.array(palette_radboud[0:3]) * 255).astype(int)\nb = np.copy(a)\na[:,:] = (np.array(palette_radboud[3:6]) * 255).astype(int)\nb = np.concatenate((b, a), axis=1)\na[:,:] = (np.array(palette_radboud[6:9]) * 255).astype(int)\nb = np.concatenate((b, a), axis=1)\n\na[:,:] = (np.array(palette_radboud[9:12]) * 255).astype(int)\nc = np.copy(a)\na[:,:] = (np.array(palette_radboud[12:15]) * 255).astype(int)\nc = np.concatenate((c, a), axis=1)\na[:,:] = (np.array(palette_radboud[15:18]) * 255).astype(int)\nc = np.concatenate((c, a), axis=1)\n\nd = np.concatenate((b, c), axis=0)\n\nIPython.display.display(PIL.Image.fromarray(d))\n\nprint('--- Radboud dataset ---')\nprint('Black\\tbackground\\t\\t0')\nprint('Gray\\tstroma\\t\\t\\t1')\nprint('Green\\tbenign epithelium\\t2')\nprint('Yellow\\tGleason-3 cancer\\t3')\nprint('Orange\\tGleason-4 cancer\\t4')\nprint('Red\\tGleason-5 cancer\\t5')\n\na[:,:] = (np.array(palette_karolinska[0:3]) * 255).astype(int)\nb = np.copy(a)\na[:,:] = (np.array(palette_karolinska[3:6]) * 255).astype(int)\nb = np.concatenate((b, a), axis=1)\na[:,:] = (np.array(palette_karolinska[6:9]) * 255).astype(int)\nb = np.concatenate((b, a), axis=1)\n\nIPython.display.display(PIL.Image.fromarray(b))\n\nprint('--- Karolinska dataset ---')\nprint('Black\\tbackground\\t0')\nprint('Gray\\tbenign\\t\\t1')\nprint('Red\\tcancer\\t\\t2')\ndel(a); del(b); del(c); del(d)","execution_count":null,"outputs":[]},{"metadata":{},"cell_type":"markdown","source":"# Read, save, load a patch/mask\nObtained from [Getting started with the PANDA dataset](https://www.kaggle.com/wouterbulten/getting-started-with-the-panda-dataset)"},{"metadata":{"trusted":true},"cell_type":"code","source":"import shutil\n\nworkdir = '/kaggle/working/' # directory with write access\nsize = (256, 256) # patch size\n\ndef get_patch(image_id, coor, size=size, data=data_dir):\n \"\"\" Show patch from the whole-slide image\n image_id - image ID\n coor - (x, y) coordinates of the upper left corner of the patch\n size - (w, h) width and height of the patch to get\n data - dataset, WSI image or its mask\n \"\"\"\n # Open the image (does not yet read the image into memory)\n image = openslide.OpenSlide(os.path.join(data, f'{image_id}.tiff'))\n # Read a specific region of the image starting at upper left coordinate\n # 'coor' on level 0 and extracting a 'size' pixel patch.\n # At this point image data is read from the file and loaded into memory.\n patch = image.read_region(coor, 0, size)\n patch = patch.convert('RGB') # convert from RGBA to RGB\n image.close() # close the opened slide after use\n del(image)\n return patch\n\ndef overlay_images(patch, mask, dataset):\n \"\"\" Overlay 2 images together\n patch - 1st image, patch\n mask - 2nd image, mask\n dataset - radboud or karolinska\n \"\"\"\n # Create alpha mask\n alpha_int = round(255 * 0.4) # opacity\n if dataset == 'radboud':\n alpha_mask = 255 + (np.less(mask, 2).astype('uint8') - 1) * alpha_int\n else: # dataset == 'karolinska'\n alpha_mask = 255 + (np.less(mask, 1).astype('uint8') - 1) * alpha_int\n alpha_mask = PIL.Image.fromarray(alpha_mask)\n #\n return PIL.Image.composite(\n image1=patch,\n image2=mask.convert(mode='RGB'), # convert from RGBA to RGB\n mask=alpha_mask)\n\ndef show_patch(image_id, coor, size=size):\n \"\"\" Show patch from the whole-slide image \"\"\"\n patch = get_patch(image_id, coor, size)\n mask = get_mask(image_id, coor, size)\n dataset = train.loc[image_id]['data_provider'] # get dataset name\n overlayed = overlay_images(patch, mask, dataset)\n # Concatenate 3 images together\n output = PIL.Image.new('RGBA', (patch.width*3, patch.height))\n output.paste(patch, (0, 0))\n output.paste(overlayed, (patch.width, 0))\n output.paste(mask, (patch.width*2, 0))\n display(output)\n\ndef patch_name(image_id, coor, size):\n \"\"\" Create patch file name like:\n 0005f7aa_kar_0+0_0_03328_03328_1.png \n 00f6ea01_rad_3+3_1_04096_03840_3.png\n Format:\n {uid}_{rad/kar}_{i+j}_{ISUP}_{x_y}_{n}.png\n where:\n uid - first 8 characters from WSI {image_id} name\n 'rad' - radboud or 'kar' - karolinska from {data_provider}\n i+j - Gleason score. If 'negative' then '0+0'.\n ISUP - ISUP grade. The label.\n x and y upper left corner patch coordinates on WSI image\n n - patch class, max number of its mask\n \"\"\"\n row = train.loc[image_id] # get row by index\n uid = image_id[:8] # first 8 characters are enough for ID\n rad_kar = row['data_provider'][:3]\n gleason = row['gleason_score']\n if gleason == 'negative':\n gleason = '0+0'\n isup = row['isup_grade']\n x_y = f'{coor[0]:05d}_{coor[1]:05d}'\n mask = get_patch(image_id+'_mask', coor, size, data=mask_dir) # get mask\n n = np.ndarray.max(np.array(mask)) # max number of the mask\n filename = f'{uid}_{rad_kar}_{gleason}_{isup}_{x_y}_{n}.png'\n return filename\n\ndef save_patch(image_id, coor, size=size):\n \"\"\" Save patch from the whole-slide image to the file system \"\"\"\n patch = get_patch(image_id, coor, size)\n filename = patch_name(image_id, coor, size) # get file name\n patch.save(workdir + filename) # save patch image\n #\n mask = get_mask(image_id, coor, size)\n mask_file = filename[:-4] + '_mask.png'\n mask.save(workdir + mask_file) # save mask image\n #\n dataset = train.loc[image_id]['data_provider'] # get dataset name\n overlayed = overlay_images(patch, mask, dataset)\n overlayed_file = filename[:-4] + '_overlay.png'\n overlayed.save(workdir + overlayed_file) # save overlayed image\n return filename, overlayed_file, mask_file\n\ndef load_patch(image_id, coor, size=size):\n \"\"\" Load images from Jupyter Notebook \"\"\"\n images = save_patch(image_id, coor, size)\n # Change directory to workdir otherwise it'll not work\n os.chdir(workdir)\n html = (f'{images[0]}
'\n f'{images[1]}
'\n f'{images[2]}')\n return HTML(html)\n\ndef get_mask(image_id, coor, size=size):\n \"\"\" Get mask from the whole-slide mask \"\"\"\n mask = get_patch(f'{image_id}_mask', coor, size, data=mask_dir)\n mask = mask.split()[0] # mask is present in the R channel\n dataset = train.loc[image_id]['data_provider']\n if dataset == 'radboud':\n palette = (np.array(palette_radboud) * 255).astype(int)\n else: # dataset == 'karolinska':\n palette = (np.array(palette_karolinska) * 255).astype(int)\n mask.putpalette(data=palette.tolist()) # see --> PIL.Image.putpalette\n return mask\n\ndef show_mask(image_id, coor, size=size):\n \"\"\" Show mask from the whole-slide mask \"\"\"\n mask = get_mask(image_id, coor, size)\n display(mask)\n\ndef get_wsi_mask(image_id, level=0, alpha=None):\n \"\"\" Get WSI mask\n image_id - image ID\n level - zoom level, can be [0, 1, 2]\n \"\"\"\n mask = openslide.OpenSlide(os.path.join(mask_dir, f'{image_id}_mask.tiff'))\n dataset = train.loc[image_id][\"data_provider\"] # get dataset name\n # Load data from the level\n mask_data = mask.read_region((0,0), level, mask.level_dimensions[level])\n mask_data = mask_data.split()[0] # mask data is present in the R channel\n # Create alpha mask\n if alpha is None:\n alpha_mask = None\n else:\n alpha_int = round(255 * alpha)\n if dataset == 'radboud':\n alpha_mask = 255 + (np.less(mask_data, 2).astype('uint8') - 1) * alpha_int\n else: # dataset == 'karolinska'\n alpha_mask = 255 + (np.less(mask_data, 1).astype('uint8') - 1) * alpha_int\n alpha_mask = PIL.Image.fromarray(alpha_mask)\n # Set palette\n dataset = train.loc[image_id]['data_provider']\n if dataset == 'radboud':\n palette = (np.array(palette_radboud) * 255).astype(int)\n else: # dataset == 'karolinska':\n palette = (np.array(palette_karolinska) * 255).astype(int)\n mask_data.putpalette(data=palette.tolist())\n mask_data = mask_data.convert(mode='RGB') # convert from RGBA to RGB\n mask.close()\n del(mask)\n return mask_data, alpha_mask\n\ndef overlay_wsi(image_id, level=0, alpha=0.5):\n \"\"\" Overlay WSI image with its mask.\n image_id - image ID\n level - zoom level, can be [0, 1, 2]\n \"\"\"\n image = openslide.OpenSlide(os.path.join(data_dir, f'{image_id}.tiff'))\n image_data = image.read_region((0,0), level, image.level_dimensions[level])\n mask_data, alpha_mask = get_wsi_mask(image_id, level, alpha)\n overlayed_image = PIL.Image.composite(image1=image_data, image2=mask_data, mask=alpha_mask)\n image.close()\n del(image)\n return overlayed_image\n\ndef show_wsi(image_id, show=True, show_mask=True,\n size=None, link=True, info=True,\n alpha=0.5, level=2):\n \"\"\" Show WSI image and information about it.\n show - show image or not\n show_mask - overlay image with the mask\n size - thumbnail size, None - original size\n link - show link to download WSI image\n info - show info about image\n alpha - overlay opacity of the mask\n level - zoom level, can be [0, 1, 2]\n \"\"\"\n image = openslide.OpenSlide(os.path.join(data_dir, f'{image_id}.tiff'))\n\n # Get some info about image\n row = train.loc[image_id]\n dataset = row[\"data_provider\"] # get dataset name\n if info: # show info\n # Here we compute the \"pixel spacing\": the physical size of a pixel in the image.\n # OpenSlide gives the resolution in centimeters so we convert this to microns.\n resolution = 10000 / float(image.properties['tiff.XResolution'])\n print(f'dataset:\\t{dataset}')\n print(f'size:\\t\\t{image.dimensions}')\n print(f'resolution:\\t{resolution:.4f}')\n print(f'ISUP grade:\\t{row[\"isup_grade\"]}')\n print(f'Gleason score:\\t{row[\"gleason_score\"]}')\n \n if show: # show image\n if show_mask: # show image with mask\n overlayed_image = overlay_wsi(image_id, level, alpha)\n if size is not None:\n overlayed_image.thumbnail(size=size, resample=0)\n display(overlayed_image)\n if link:\n filename = f'{image_id}_overlay.jpg' # overlayed image\n overlayed_image.save(workdir + filename) # save the image\n else: # show image without mask\n if size is not None:\n image_data = image.get_thumbnail(size=size)\n display(image_data)\n if link:\n filename = f'{image_id}_thumbnail.jpg' # thumbnail image\n image_data.save(workdir + filename)\n else: # show image without mask and with original size\n image_data = image.read_region((0,0), level, image.level_dimensions[level])\n display(image_data)\n if link:\n filename = f'{image_id}.tiff' # original image\n shutil.copy(os.path.join(data_dir, f'{image_id}.tiff'), workdir)\n else: # don't show image\n if link:\n filename = f'{image_id}.tiff' # original image\n shutil.copy(os.path.join(data_dir, f'{image_id}.tiff'), workdir)\n\n image.close()\n del(image)\n\n if link:\n # Change directory to workdir otherwise it'll not work\n os.chdir(workdir)\n return FileLink(filename)\n\ndef show_wsi_mask(image_id, size=(600, 800)):\n \"\"\" Show mask for the WSI image \"\"\"\n mask_data, _ = get_wsi_mask(image_id, level=2) # get mask\n mask_data.thumbnail(size=size, resample=0) # create thumbnail\n display(mask_data)\n\ndef load_wsi(image_id, alpha=0.3):\n \"\"\" Get link to overlayed WSI image \"\"\"\n overlayed_image = overlay_wsi(image_id, level=0, alpha=alpha)\n filename = f'{image_id}_review.jpg' # overlayed image\n overlayed_image.save(workdir + filename) # save the image\n # Change directory to workdir otherwise it'll not work\n os.chdir(workdir)\n return FileLink(filename)\n\ndef link_wsi(image_id):\n \"\"\" Get downloadable link on WSI file \"\"\"\n filename = f'{image_id}.tiff'\n shutil.copy(os.path.join(data_dir, filename), workdir)\n os.chdir(workdir)\n html = f'{filename}'\n return HTML(html)","execution_count":null,"outputs":[]},{"metadata":{"trusted":true},"cell_type":"code","source":"size = (4000, 17000)\nshow_patch('00928370e2dfeb8a507667ef1d4efcbb', size)\nload_patch('00928370e2dfeb8a507667ef1d4efcbb', size)","execution_count":null,"outputs":[]},{"metadata":{"trusted":true},"cell_type":"code","source":"show_wsi('08ab45297bfe652cc0397f4b37719ba1', size=(600, 600))","execution_count":null,"outputs":[]},{"metadata":{"trusted":true},"cell_type":"code","source":"show_wsi_mask('08ab45297bfe652cc0397f4b37719ba1', size=(300, 400))","execution_count":null,"outputs":[]},{"metadata":{"trusted":true},"cell_type":"code","source":"# Open and review WSI with masks in the browser\n# Sometimes there is an error\nload_wsi('08ab45297bfe652cc0397f4b37719ba1')","execution_count":null,"outputs":[]},{"metadata":{},"cell_type":"markdown","source":"# Cut WSI\nObtained from [PANDA: Dividing each image into 256x256 Images](https://www.kaggle.com/kaushal2896/panda-dividing-each-image-into-256x256-images)"},{"metadata":{"trusted":true},"cell_type":"code","source":"import math\nimport shutil\nimport multiprocessing\nimport tqdm.notebook as tqdm\n\nfrom joblib import Parallel, delayed\n\ncut_size = 256 # size of resultant images\ncut_level = 2 # slide level resolution, use 0 to cut original WSI\ndown_samples = [1, 4, 16] # down samples list available in any tiff WSI\ncpu_cores = multiprocessing.cpu_count() # number of cores on the CPU\n\ndef test_cut_wsi(image_id, size=cut_size, level=cut_level):\n \"\"\" Test toy function to cut the given WSI into multiple images \"\"\"\n image = openslide.OpenSlide(os.path.join(data_dir, f'{image_id}.tiff'))\n\n # Get the size of the image on the zoom level\n width, height = image.level_dimensions[level]\n\n # Get the number of smaller images\n h_cuts = math.ceil(width / size)\n v_cuts = math.ceil(height / size)\n\n patches = []\n for v in range(v_cuts):\n for h in range(h_cuts):\n x_location = h * size * down_samples[level]\n y_location = v * size * down_samples[level]\n patch = image.read_region((x_location, y_location), level, (size, size))\n patches.append(patch)\n image.close()\n del(image)\n return patches, h_cuts, v_cuts\n\ndef cut_image(image_id, dirname):\n \"\"\" Cut image into multiple patches \"\"\"\n size = 256 # size of the patch\n image = openslide.OpenSlide(os.path.join(data_dir, f'{image_id}.tiff'))\n w, h = image.dimensions\n for v in range(0, h, size):\n for h in range(0, w, size):\n patch = image.read_region((h, v), 0, (size, size)) # get patch\n patch = patch.convert(mode='RGB') # convert from RGBA to RGB\n\n # Consider gray color as \"empty\" background\n r, g, b = patch.split() # split on red, green, blue colors\n r, g, b = np.array(r)/255, np.array(g)/255, np.array(b)/255\n mean = (r + g + b) / 3 # get mean value\n # Get standard deviation\n deviation = np.sqrt(((r-mean)**2 + (g-mean)**2 + (b-mean)**2) / 3)\n # EXPERIMENT with the deviation threshold\n emptiness = (np.count_nonzero(deviation < 0.01)) / deviation.size\n\n # EXPERIMENT with empty images\n \"\"\"\n if emptiness > 0.65 and emptiness < 0.75:\n print(emptiness) # show coefficient\n display(patch) # show patch\n \"\"\"\n\n if emptiness < 0.65: # ignore 65% empty images\n # Save output image\n name = patch_name(image_id, (h, v), (size, size)) # get patch name\n patch.save(os.path.join(dirname, name)) # save patch image\n image.close() # close image to free the RAM\n del(image)\n\ndef cut_wsi(image_id):\n \"\"\" Cut WSI image(s) into multiple patches\n and get a link to a ZIP archive with patches.\n \"\"\"\n if isinstance(image_id, str): # one WSI image\n zip_name = f'{image_id}'\n image_id = [image_id] # convert string to list\n # Non-empty list of WSI images\n elif isinstance(image_id, list) and len(image_id):\n zip_name = 'dataset'\n else: # wrong parameter\n return None\n\n dirname = os.path.join(workdir, zip_name)\n shutil.rmtree(dirname, ignore_errors=True) # remove previous dir\n os.makedirs(dirname) # create empty dir\n\n Parallel(n_jobs=cpu_cores)(delayed(cut_image)(im_id, dirname)\n for im_id in tqdm.tqdm(image_id))\n\n # Create a ZIP archive\n os.chdir(workdir)\n shutil.make_archive(zip_name, 'zip', dirname)\n # Get downloadable link to the ZIP archive\n html = f'{zip_name}.zip'\n return HTML(html)","execution_count":null,"outputs":[]},{"metadata":{"trusted":true},"cell_type":"code","source":"# Lets cut several images. Cutting all images will take many hours on Kaggle.\nids = ['ffc70bf605de30aaa936533397a29d9c',\n 'fca1f600d0d453a15d9251eb505523fc',\n 'f96885e98ce7050f21a86bb312f90c89',]\n\nimport time\n\nstart = time.time()\nlink = cut_wsi(ids)\nend = time.time()\n\nprint('time:', end - start)\ndisplay(link)","execution_count":null,"outputs":[]},{"metadata":{"trusted":true},"cell_type":"code","source":"cut_wsi('08ab45297bfe652cc0397f4b37719ba1')","execution_count":null,"outputs":[]},{"metadata":{"trusted":true},"cell_type":"code","source":"# These patches are excluded from the dataset\nshow_patch('08ab45297bfe652cc0397f4b37719ba1', (0, 1024))","execution_count":null,"outputs":[]},{"metadata":{"trusted":true},"cell_type":"code","source":"# NOTE! For many patches it'll be extremely slow visualization\npatches, h_cuts, v_cuts = test_cut_wsi('08ab45297bfe652cc0397f4b37719ba1')\n_, axs = plt.subplots(nrows=v_cuts, ncols=h_cuts, figsize=(12, 12))\naxs = axs.flatten()\nfor patch, ax in zip(patches, axs):\n ax.axis('on')\n ax.grid(False)\n ax.imshow(patch)\nplt.show()","execution_count":null,"outputs":[]},{"metadata":{},"cell_type":"markdown","source":"# Visualization\nObtained from [PANDA: EDA + Visualisation + Cleaning](https://www.kaggle.com/rai555/panda-eda-visualisation-cleaning)"},{"metadata":{"trusted":true},"cell_type":"code","source":"# No NaN values in train.csv file - Ok\nprint('NaN or empty values:', train.isna().any().any())","execution_count":null,"outputs":[]},{"metadata":{"trusted":true},"cell_type":"code","source":"# Proof that only 8 characters of {image_id} is enough for ID\narr = np.array(train.index) # get all indices\nl = []\nfor a in arr:\n l.append(a[:8]) # truncate to 8 chars\n_, counts = np.unique(l, return_counts=True)\nprint('All unique:', max(counts) == 1) # first 7 or 8 chars are enough for ID","execution_count":null,"outputs":[]},{"metadata":{"trusted":true},"cell_type":"code","source":"# Information about TIFF image\nimage = openslide.OpenSlide(os.path.join(data_dir, '005e66f06bce9c2e49142536caf2f6ee.tiff'))\n\np = image.properties\nfor x in p:\n print (x, '\\t', p[x])\n\nimage.close()","execution_count":null,"outputs":[]},{"metadata":{"trusted":true},"cell_type":"code","source":"import seaborn as sns\npalette = ['#440154FF','#20A387FF']\n\nsns.set(style='whitegrid', font_scale=1.5)\nfig, ax = plt.subplots(1, 2, figsize=(15,5))\ntrain['data_provider'].value_counts().plot.pie(autopct='%1.1f%%', ax=ax[0], colors=palette,\n pctdistance=1.1, labeldistance=1.2)\nax[0].set_ylabel('')\nsns.countplot('data_provider', data=train, ax=ax[1], palette=palette)\nfig.suptitle('Distribution of Images between the Data Providers', fontsize = 14)\nplt.show()","execution_count":null,"outputs":[]},{"metadata":{},"cell_type":"markdown","source":"### Checked with minor edit of the function below:\n01. XResolution and YResolution are equal.\n\n```python\nresolution = 10000 / float(image.properties['tiff.XResolution'])\ny_resolution = 10000 / float(image.properties['tiff.YResolution'])\nif resolution != y_resolution:\n print(image_id, resolution, y_resolution)\n```\n\n02. Mask size and image size are equal.\n\n```python\nsize = image.dimensions # get image size\nsize_mask = mask.dimensions # get mask size\nif size != size_mask:\n print(image_id, size, size_mask)\n```\n\n03. Can read at least the beginning of the image and its mask.\n\n```python\nimage_data = image.read_region((0,0), 0, (512, 512))\nmask_data = mask.read_region((0,0), 0, (512, 512))\n```"},{"metadata":{"trusted":true},"cell_type":"code","source":"import tqdm.notebook as tqdm\n\ndef get_size(image_id):\n \"\"\" Get image size \"\"\"\n image = openslide.OpenSlide(os.path.join(data_dir, f'{image_id}.tiff'))\n size = image.dimensions # get image size\n\n try:\n err = None\n mask = openslide.OpenSlide(os.path.join(mask_dir, f'{image_id}_mask.tiff'))\n \n size = image.dimensions # get image size\n size_mask = mask.dimensions # get mask size\n if size != size_mask:\n print(image_id, size, size_mask)\n \n except openslide.OpenSlideUnsupportedFormatError:\n # Unsupported or missing image file\n err = image_id\n\n resolution = 10000 / float(image.properties['tiff.XResolution'])\n image.close() # close the opened slide after use\n del(image) # maybe this should free some RAM\n return size, resolution, err\n\nwidth = []\nheight = []\nresolution = []\ncorrupted_mask = []\narr = np.array(train.index) # get all indices\n\nfor a in tqdm.tqdm(arr):\n size, res, err = get_size(a)\n width.append(size[0])\n height.append(size[1])\n resolution.append(res)\n if err is not None:\n corrupted_mask.append(err)\n\ntrain['width'] = width # new column 'width'\ntrain['height'] = height # new column 'height'\ntrain['resolution'] = resolution # new column 'resolution'\n\nprint('Biggest image width:\\t', max(width))\nprint('Smallest image width:\\t', min(width))\nprint('Biggest image height:\\t', max(height))\nprint('Smallest image height:\\t', min(height))\n\n# Clean data to save RAM\nimport gc\ndel(width); del(height); del(resolution); del(arr)\n_ = gc.collect()","execution_count":null,"outputs":[]},{"metadata":{"trusted":true},"cell_type":"code","source":"# Clean data to save RAM\nimport gc\n_ = gc.collect()","execution_count":null,"outputs":[]},{"metadata":{"trusted":true},"cell_type":"code","source":"# As I can see, we can not open these masks\nprint('Number of corrupted masks:', len(corrupted_mask))","execution_count":null,"outputs":[]},{"metadata":{"trusted":true},"cell_type":"code","source":"pd.set_option('display.max_rows', None, 'display.max_columns', None)\ntrain.loc[corrupted_mask]","execution_count":null,"outputs":[]},{"metadata":{},"cell_type":"markdown","source":"All 100 corrupted masks are from Radboud dataset. Delete them from the train set."},{"metadata":{"trusted":true},"cell_type":"code","source":"rows, cols = train.shape\nprint('Rows before:\\t', rows)\ntrain.drop(corrupted_mask, errors='ignore', inplace=True) # exclude indices from the table\nrows, cols = train.shape\nprint('Rows after:\\t', rows)","execution_count":null,"outputs":[]},{"metadata":{"trusted":true},"cell_type":"code","source":"sns.set(style='whitegrid', font_scale=1.5)\n\nfig = plt.figure(figsize=(18,8))\nax = sns.scatterplot(x='width', y='height', data=train, hue='data_provider',\n palette=palette, alpha=0.5)\nax.tick_params(labelsize=14)\nplt.title('Dimensions of Images')\nplt.show()","execution_count":null,"outputs":[]},{"metadata":{"trusted":true},"cell_type":"code","source":"fig, ax = plt.subplots(1, 2)\nfig.set_size_inches(15, 5)\n\nsns.stripplot(train['width'],train['data_provider'],ax=ax[0], palette=palette,jitter=True)\nsns.stripplot(train['height'],train['data_provider'],ax=ax[1], palette=palette,jitter=True)\n\nax[0].tick_params(labelsize=14)\nax[1].tick_params(labelsize=14)\nax[0].tick_params(labelrotation=90)\nax[1].tick_params(labelrotation=90)\nplt.show()","execution_count":null,"outputs":[]},{"metadata":{"trusted":true},"cell_type":"code","source":"fig, ax = plt.subplots(1, 2)\nfig.set_size_inches(18, 8)\n\nsns.stripplot(train['resolution'],train['data_provider'],ax=ax[0], palette=palette,jitter=True)\nsns.countplot('resolution', data=train, ax=ax[1], palette=palette)\n\nax[0].tick_params(labelsize=14)\nax[1].tick_params(labelsize=14)\nax[0].tick_params(labelrotation=90)\nax[1].tick_params(labelrotation=90)\nplt.show()","execution_count":null,"outputs":[]},{"metadata":{"trusted":true},"cell_type":"code","source":"fig, ax = plt.subplots(1, 2)\nfig.set_size_inches(15, 6)\n\nsns.countplot(x='isup_grade', data=train, ax=ax[0], palette='viridis',\n order=train['isup_grade'].value_counts().index)\nsns.countplot(x='gleason_score', data=train, ax=ax[1], palette='viridis',\n order=train['gleason_score'].value_counts().index)\n\nax[0].set_title('ISUP Grade (target variable)', y=1.0, fontsize=14)\nax[1].set_title('Gleason Score', y=1.0, fontsize=14)\n\nfor axis in ['top', 'bottom', 'left', 'right']:\n ax[0].spines[axis].set_linewidth(0.7)\n ax[1].spines[axis].set_linewidth(0.7)\n \nax[0].tick_params(labelsize=14)\nax[1].tick_params(labelsize=14)\n\nplt.tight_layout()\nplt.subplots_adjust(hspace=0.2)\nplt.show()","execution_count":null,"outputs":[]},{"metadata":{"trusted":true},"cell_type":"code","source":"fig, ax = plt.subplots(1, 2)\nfig.set_size_inches(15, 6)\n\nsns.countplot(x='isup_grade', data=train, hue='resolution',\n ax=ax[0], palette='viridis',\n order=train['isup_grade'].value_counts().index)\nsns.countplot(x='gleason_score', data=train, hue='resolution',\n ax=ax[1], palette='viridis',\n order=train['gleason_score'].value_counts().index)\n\nax[0].set_title('ISUP Grade (target variable)', y=1.0, fontsize=14)\nax[1].set_title('Gleason Score', y=1.0, fontsize=14)\n\nfor axis in ['top', 'bottom', 'left', 'right']:\n ax[0].spines[axis].set_linewidth(0.7)\n ax[1].spines[axis].set_linewidth(0.7)\n \nax[0].tick_params(labelsize=14)\nax[1].tick_params(labelsize=14)\n\nplt.tight_layout()\nplt.subplots_adjust(hspace=0.2)\nplt.show()","execution_count":null,"outputs":[]},{"metadata":{"trusted":true},"cell_type":"code","source":"train_grouped = train.groupby('isup_grade')['gleason_score'].unique().to_frame().reset_index()\ndisplay(train_grouped)","execution_count":null,"outputs":[]},{"metadata":{},"cell_type":"markdown","source":"This table is not correspond to the table from Figure 1 in [project description](https://www.kaggle.com/c/prostate-cancer-grade-assessment/overview).\n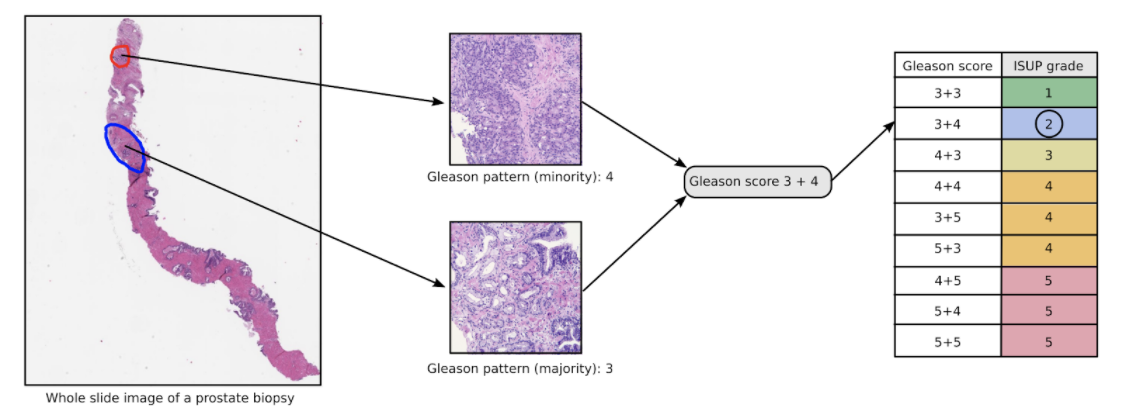"},{"metadata":{"trusted":true},"cell_type":"code","source":"# Display wrong Gleason score 4+3\ntrain[(train.isup_grade == 2) & (train.gleason_score == '4+3')].reset_index()","execution_count":null,"outputs":[]},{"metadata":{"trusted":true},"cell_type":"code","source":"show_wsi('b0a92a74cb53899311acc30b7405e101', size=(300, 300))","execution_count":null,"outputs":[]},{"metadata":{"trusted":true},"cell_type":"code","source":"# Can not load WSI - MemoryError: Integer overflow in ysize\n# It seems too big\n#load_wsi('b0a92a74cb53899311acc30b7405e101')\n# Get downloadable link instead. You can open it with ASAP viewer.\nlink_wsi('b0a92a74cb53899311acc30b7405e101')","execution_count":null,"outputs":[]},{"metadata":{},"cell_type":"markdown","source":"There is just one image and it seems like an error so let's drop it and look at our data (grouped by isup_grade)."},{"metadata":{"trusted":true},"cell_type":"code","source":"# Exclude index from the table\ntrain.drop(['b0a92a74cb53899311acc30b7405e101'], errors='ignore', inplace=True)\ntrain_grouped = train.groupby('isup_grade')['gleason_score'].unique().to_frame().reset_index()\ndisplay(train_grouped)","execution_count":null,"outputs":[]},{"metadata":{"trusted":true},"cell_type":"code","source":"fig = plt.figure(figsize=(10, 5))\nsns.set(style='whitegrid', font_scale=1.5)\n\nsns.countplot(x='isup_grade', hue='data_provider', data=train, palette=palette)\nplt.title('ISUP grade by Data Provider')\nplt.tick_params(labelsize=14)\n\nplt.tight_layout()\nplt.show()","execution_count":null,"outputs":[]},{"metadata":{"trusted":true},"cell_type":"code","source":"fig = plt.figure(figsize=(10, 5))\nsns.set(style='whitegrid', font_scale=1.5)\n\nsns.countplot(x='gleason_score', hue='data_provider', data = train, palette=palette)\nplt.title('Gleason score by Data Provider')\nplt.tick_params(labelsize=14)\n\nplt.tight_layout()\nplt.show()","execution_count":null,"outputs":[]},{"metadata":{"trusted":true},"cell_type":"code","source":"# Change 'negative' to '0+0'\ntrain.gleason_score.replace('negative', '0+0', inplace=True)\n\n# Check it\ntrain_grouped = train.groupby('isup_grade')['gleason_score'].unique().to_frame().reset_index()\ndisplay(train_grouped)","execution_count":null,"outputs":[]},{"metadata":{},"cell_type":"markdown","source":"# TODO\n* Check that Gleason score is correct for ISUP grade in all images. There are mislabeled WSI. Obtained from [WSI_Extract_Patches_Pytorch](https://www.kaggle.com/imrandude/wsi-extract-patches-pytorch)\n* Try [PANDA concat tile pooling starter](https://www.kaggle.com/iafoss/panda-concat-tile-pooling-starter-0-79-lb)"},{"metadata":{"trusted":true},"cell_type":"code","source":"compression_opts = dict(method='zip', archive_name='panda_train.csv')\ntrain.to_csv('panda_train.zip', compression=compression_opts)","execution_count":null,"outputs":[]}],"metadata":{"kernelspec":{"language":"python","display_name":"Python 3","name":"python3"},"language_info":{"pygments_lexer":"ipython3","nbconvert_exporter":"python","version":"3.6.4","file_extension":".py","codemirror_mode":{"name":"ipython","version":3},"name":"python","mimetype":"text/x-python"}},"nbformat":4,"nbformat_minor":4}