{"cells":[{"metadata":{},"cell_type":"markdown","source":"\n VinBigData Chest X-ray Abnormalities Detection
\n\n\n\n\n# 1. Introduction\n\n### 1.1 What is VinDR?\n[VinDr](https://vindr.ai/#products-section) s a comprehensive solution for medical image analysis that integrates Artificial Intelligence (AI) into a Picture Archiving and Communication System (PACS) to assist radiologists in making fast and precise diagnoses. The system is able to store, manage, and communicate DICOM images; automatically localize abnormalities and suggest diagnosis in a real-time fashion. Focusing on some of the most common imaging modalities and highly-demanding diseases, VinDr offers 6 following modules.\n\n### 1.2 What is VinDr-ChestXR?\n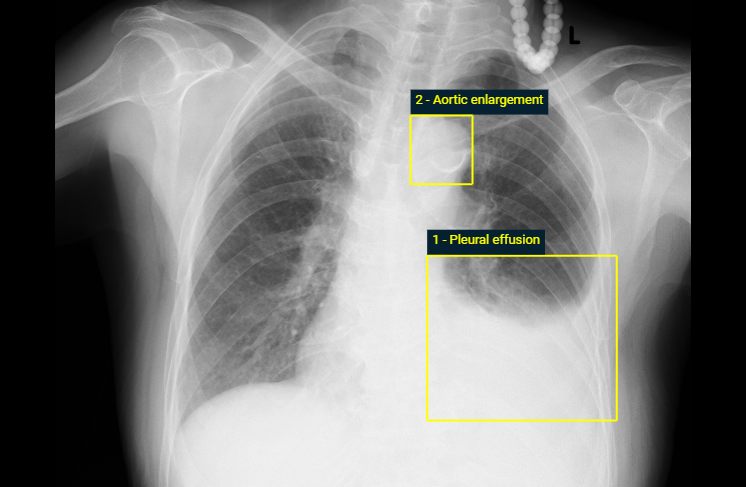\n\n\nVinDr-ChestXR is an AI-powered diagnosis system for chest X-ray interpretation. It is able to identify 6 lung diseases and localize 22 types of common abnormalities on chest X-ray. \n\nThe system has been trained and validated on half a million chest X-ray studies from both public sources and several hospitals in Vietnam. The bounding box annotation and disease labeling for our private dataset have been performed by top Vietnamese radiologists. The accuracy of the system is above 90% for almost all diseases and findings.\n\n### 1.3 What is VinBigData Chest X-ray Abnormalities Detection Competition?\n\nIn this competition, you’ll automatically localize and classify 14 types of thoracic abnormalities from chest radiographs. You'll work with a dataset consisting of 18,000 scans that have been annotated by experienced radiologists. You can train your model with 15,000 independently-labeled images and will be evaluated on a test set of 3,000 images.\n\n### 1.4 General Introduction to Thoracic Abnormalities\n\nThe thoracic anomalies represent a group of abnormalities that can be found either in the lung parenchyma or mediastinum. The thoracic cavity has a conical shape and is delimited at the posterior level by the sternum, at the superior level by the clavicle, at the lower level by the diaphragm, and at the lateral level by the ribs. In the thorax, the organs that are examined by the ultrasound are: the lungs, the heart and the mediastinum. The thoracic anomalies chapter refers to pulmonary and mediastinal fetal abnormalities, the cardiac abnormalities being a separate chapter. Congenital bronchopulmonary malformation comprises a group of abnormalities that are represented by the following entities: congenital cystic adenomatoid malformation (CCAM), bronchopulmonary sequestration (BPS), CCAM-BPS hybrid form, congenital diaphragmatic hernia (CDH), bronchogenic cyst, congenital high airway obstruction syndrome (CHAOS) and pulmonary hypoplasia/agenesis. Currently, it is recommended for the term bronchopulmonary anomalies to be used instead of congenital cystic adenomatoid malformation (CCAM) or bronchopulmonary sequestration (BPS), because it includes better the diagnosis given by the ultrasound, the prognosis and the therapeutic attitude.The thoracic-pulmonary anomalies incidence is the following: CCAM—BPS around 40%, CDH around 40% and hydrothorax and other anomalies around 10%. Thoracic abnormalities include pectus excavatum (sunken chest), pectus carinatum (protruding chest) and congenital pulmonary airway malformations (CPAM).\n\n### 1.5 What do we need to do in this competition?\n\n- we are classifying common thoracic lung diseases and localizing critical findings. This is an object detection and classification problem.\n\n- For each test image, we will be predicting a bounding box and class for all findings. If we predict that there are no findings, we should create a prediction of \"14 1 0 0 1 1\" (14 is the class ID for no finding, and this provides a one-pixel bounding box with a confidence of 1.0).\n\n- The images are in DICOM format, which means they contain additional data that might be useful for visualizing and classifying.\n\n### 1.6 Metric: Mean Average Precision(IoU > 0.4)\n\n\nwhere Q is the number of queries in the set and AveP(q) is the average precision (AP) for a given query, q.\n\nWhat the formula is essentially telling us is that, for a given query, q, we calculate its corresponding AP, and then the mean of the all these AP scores would give us a single number, called the mAP, which quantifies how good our model is at performing the query.\n\nIoU measures the overlap between 2 boundaries. We use that to measure how much our predicted boundary overlaps with the ground truth (the real object boundary). In some datasets, we predefine an IoU threshold (say 0.5) in classifying whether the prediction is a true positive or a false positive.\n\n"},{"metadata":{"trusted":true},"cell_type":"code","source":"","execution_count":null,"outputs":[]}],"metadata":{"kernelspec":{"language":"python","display_name":"Python 3","name":"python3"},"language_info":{"pygments_lexer":"ipython3","nbconvert_exporter":"python","version":"3.6.4","file_extension":".py","codemirror_mode":{"name":"ipython","version":3},"name":"python","mimetype":"text/x-python"}},"nbformat":4,"nbformat_minor":4}